Author: Alyaziah Hayat
-
USDCAD bounces back from the low level and closed at the entry price

After 4 years, USDCAD hits the 2017 Support level. USDCAD is bouncing back from the 2017 support level and lower…
-
After 4 years, Today USDCAD hits the 2017 Support level

USDCAD Historical Analysis USDCAD fall straight from the March 2020 resistance level to the Support without many retracements. After 4…
-
‘+23,740 Points fall on USDCAD from the Top Resistance during Crude Oil Crash
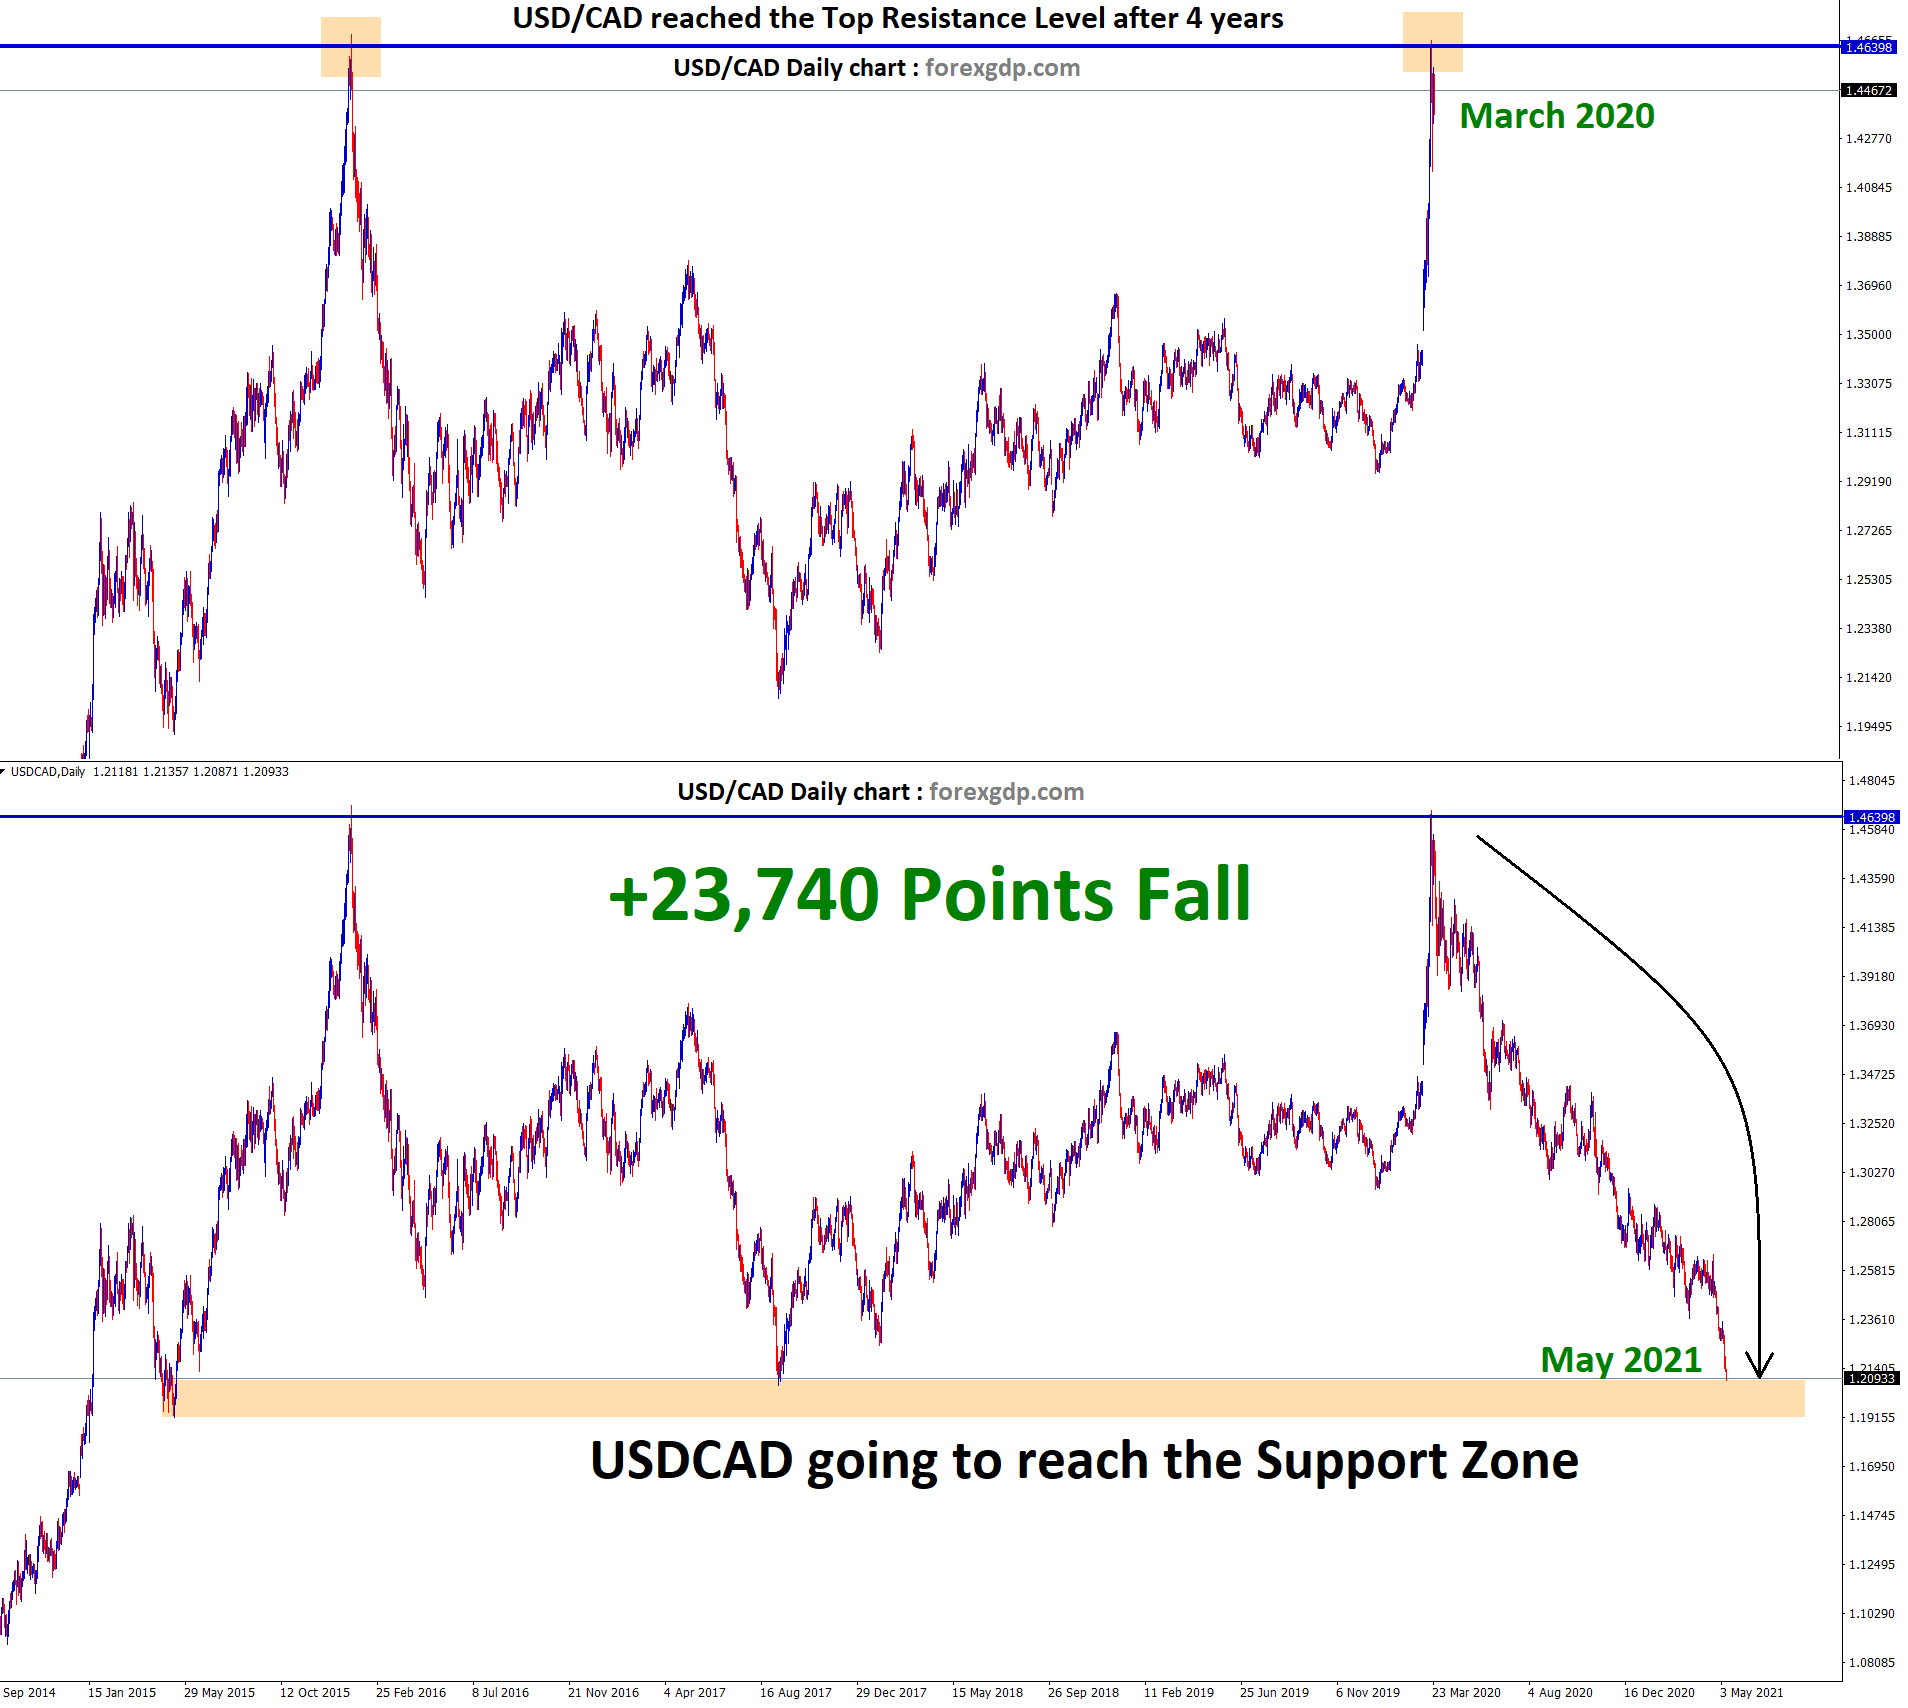
USDCAD Double Top Analysis USDCAD has formed a double top pattern in March 2020. Crude Oil crash made the USDCAD…
-
GBPNZD broke the top of the Triangle
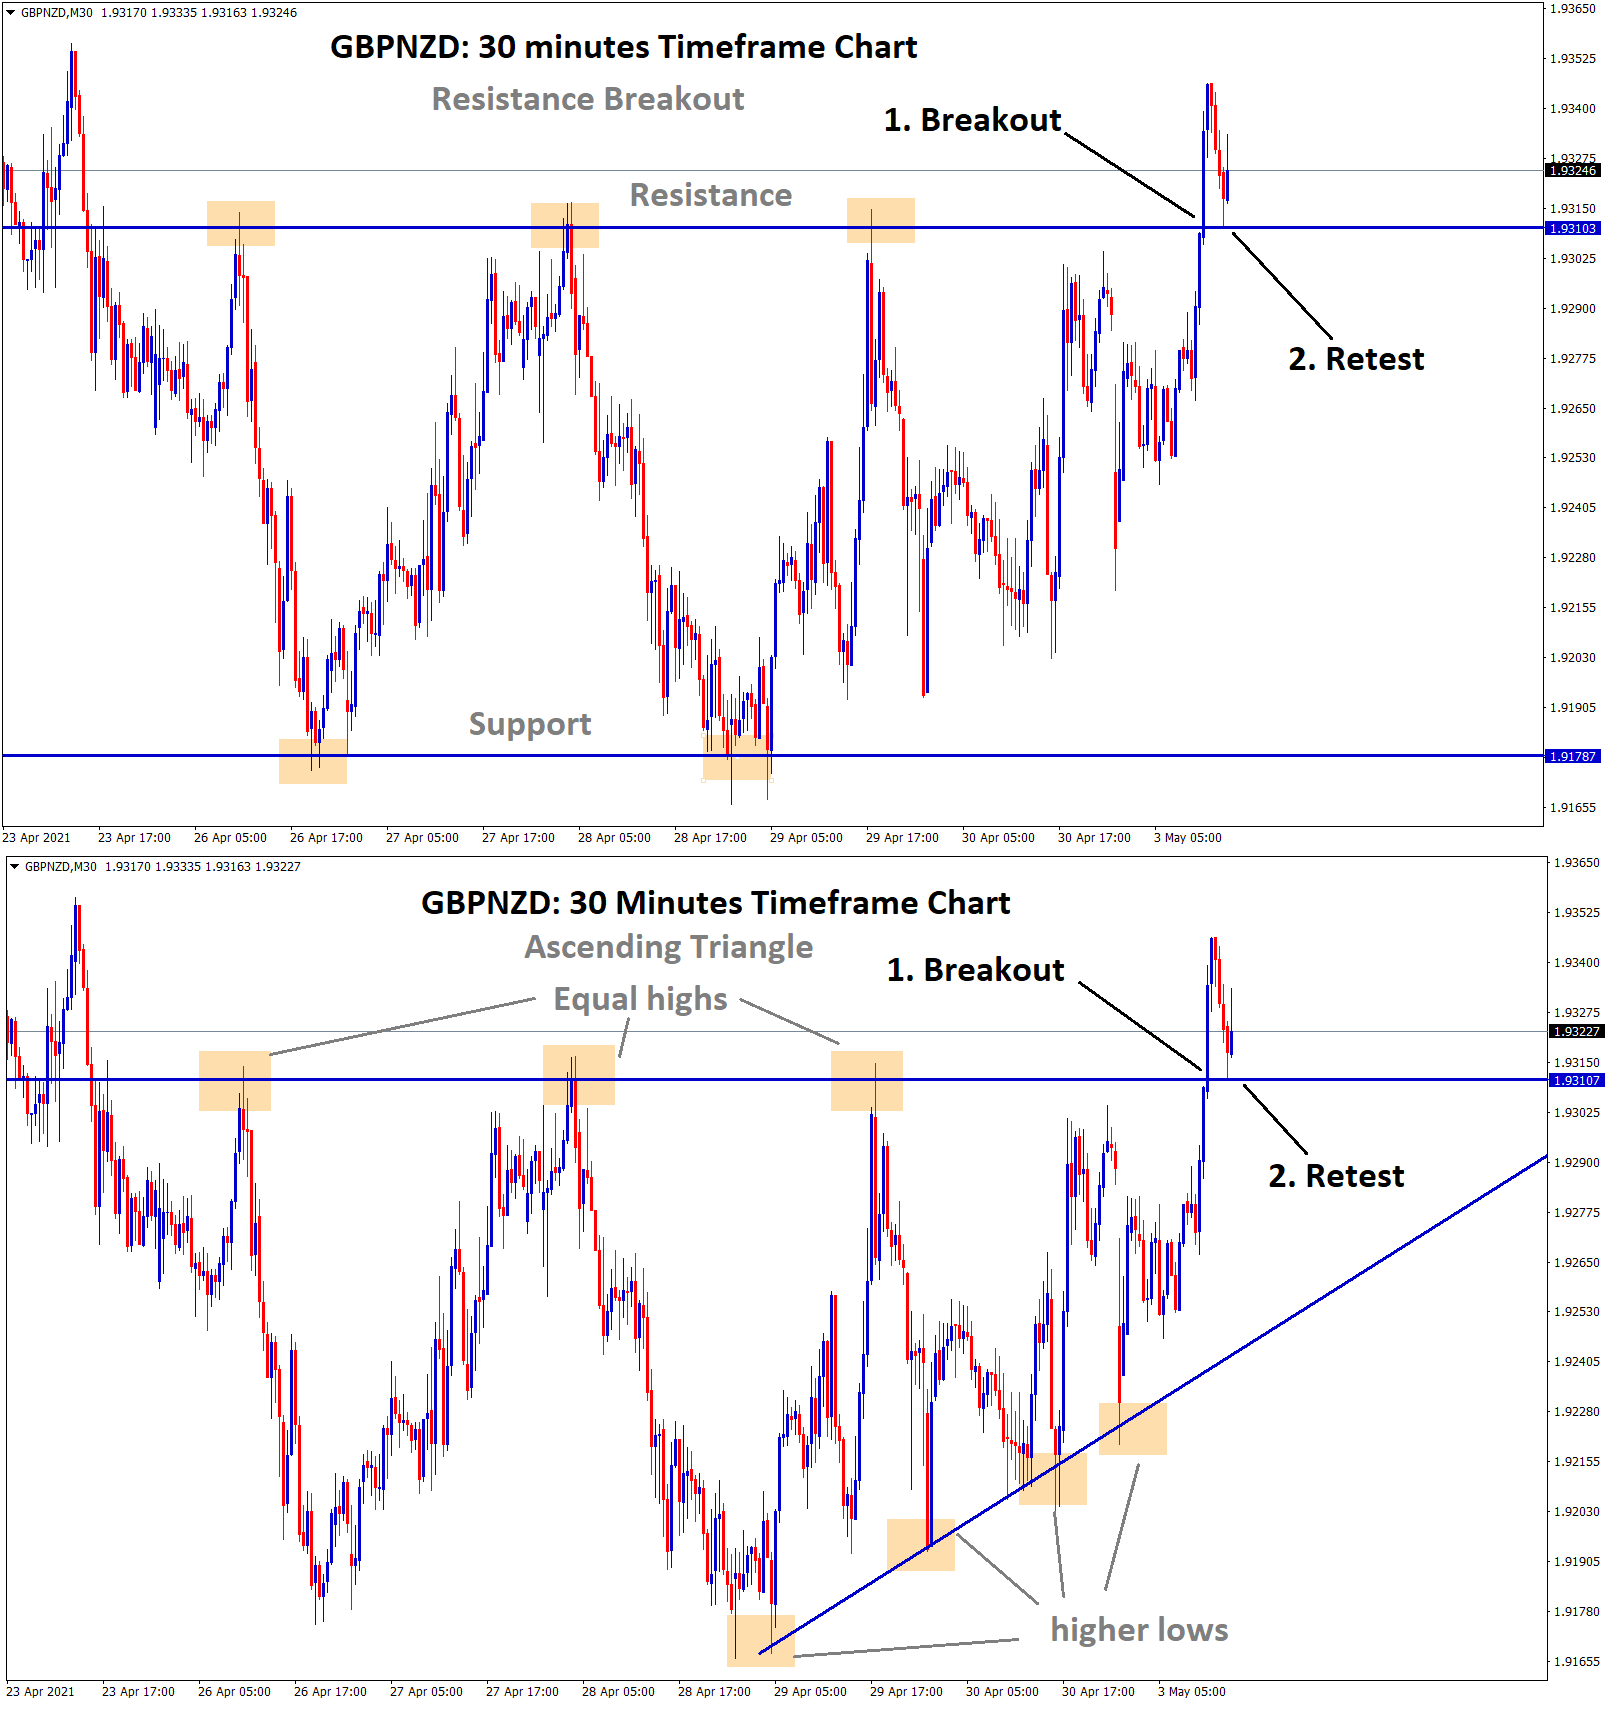
GBPNZD Analysis In the 30 minutes timeframe chart, GBPNZD has breakout and retest the resistance level in both Rectangle and…
-
Multi-year Resistance breakout after 4 years on CHFJPY
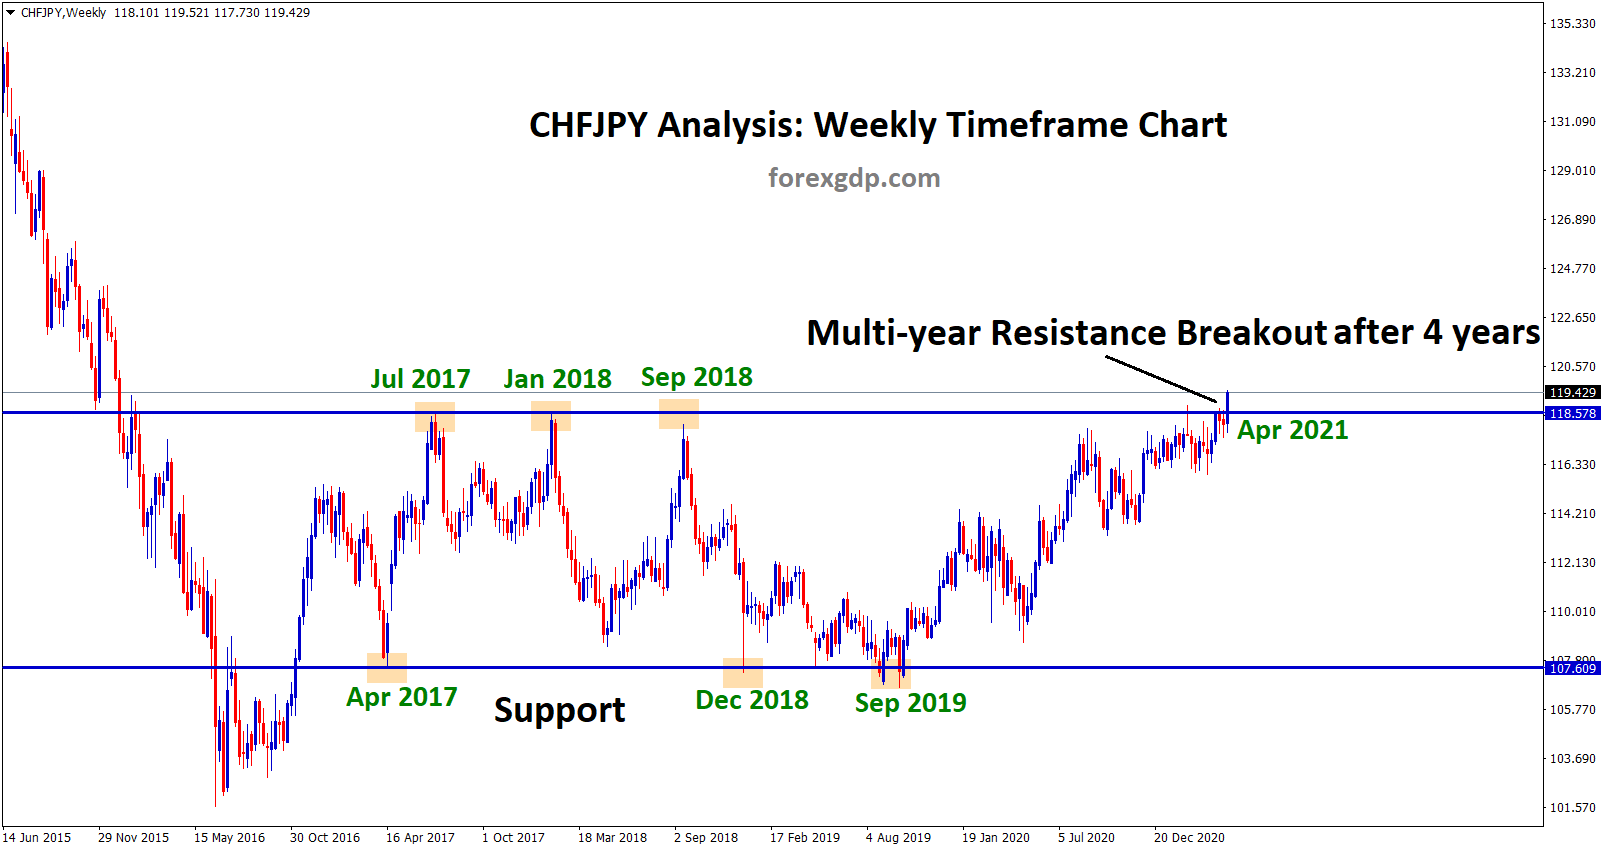
A big Bull run going to happen After 4 years, CHFJPY is breaking this multi-year resistance level in the weekly…
-
GBPCHF bounces back from the support, but due to a range movement of 2 days, GBPCHF closed at an entry price

GBPCHF Analysis GBPCHF has broken the resistance level recently in the 1-hour timeframe chart. After the breakout, the Market is…
-
USDCHF is near to the higher low level of the uptrend line in the daily timeframe chart
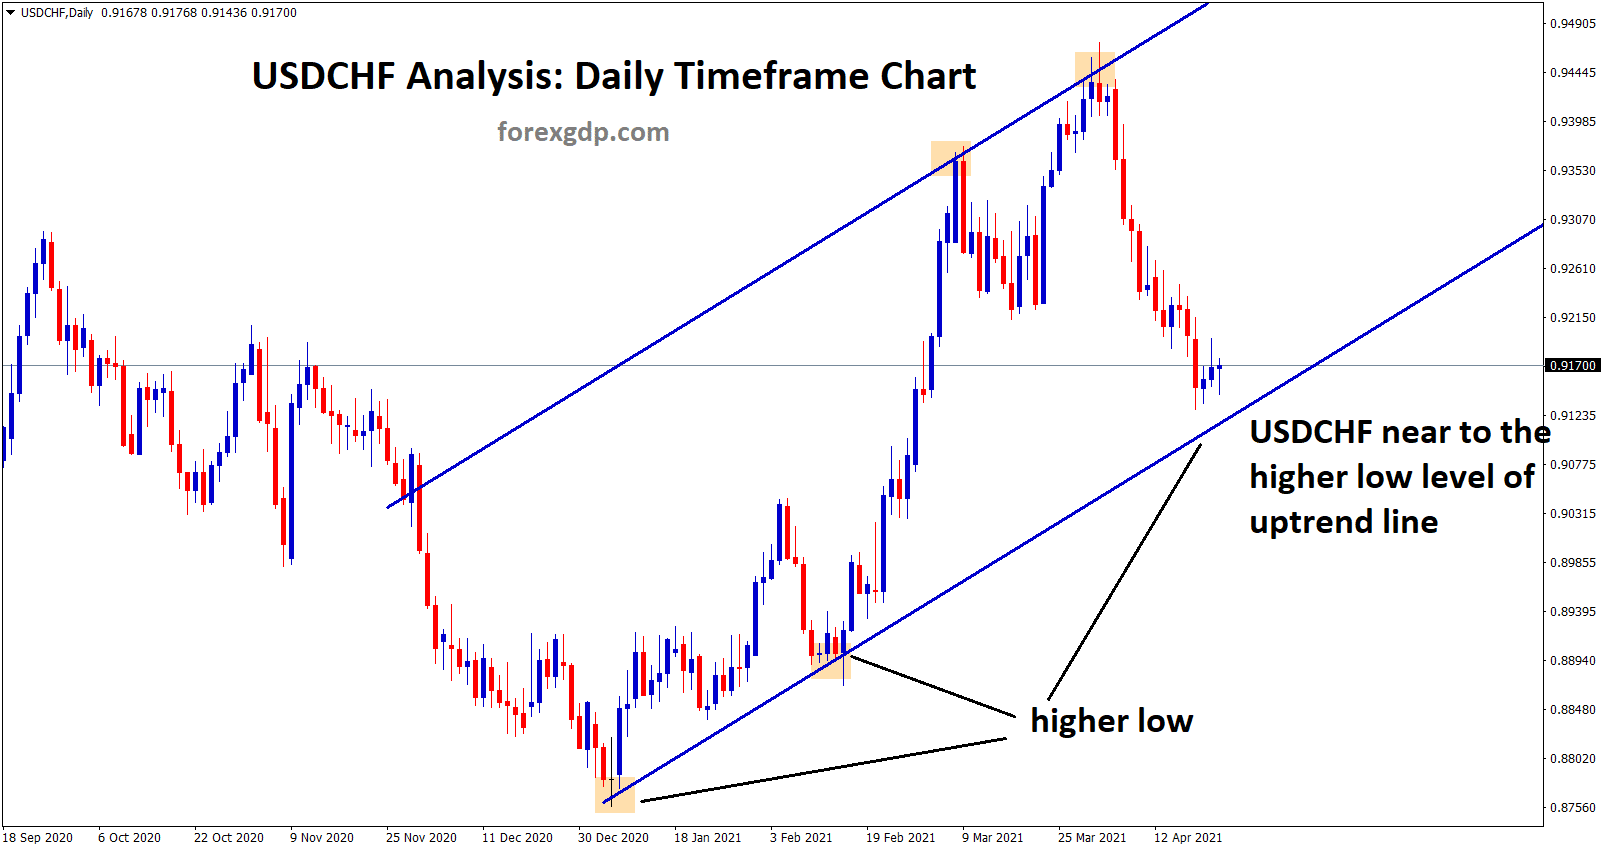
Biden plan of $1.9 trillion package plays a heavy boost for the US economy. Vaccination is progressed well as 45%…
-
USDJPY has reached the higher low level of an Uptrend line in the daily timeframe chart
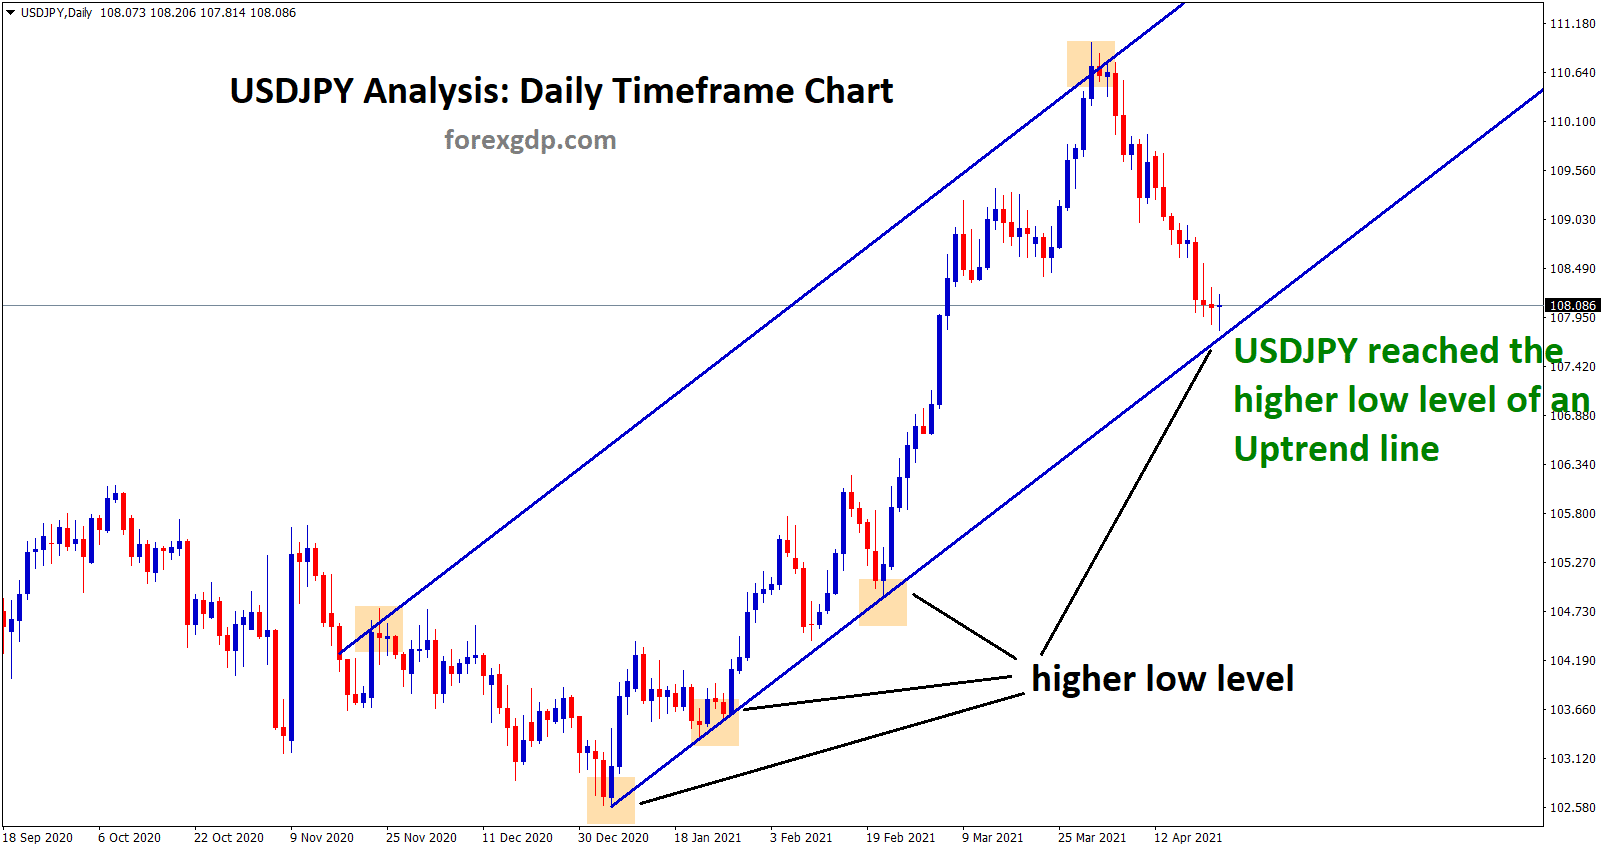
USDJPY is moving down for a long time without much retracement. Now, the market hits the higher low level of…
-
Gold and Forex Analysis

Gold Gold is moving in a minor ascending channel now. Gold prices surge more as the Third wave hits most…
-
Gold is at the Resistance level
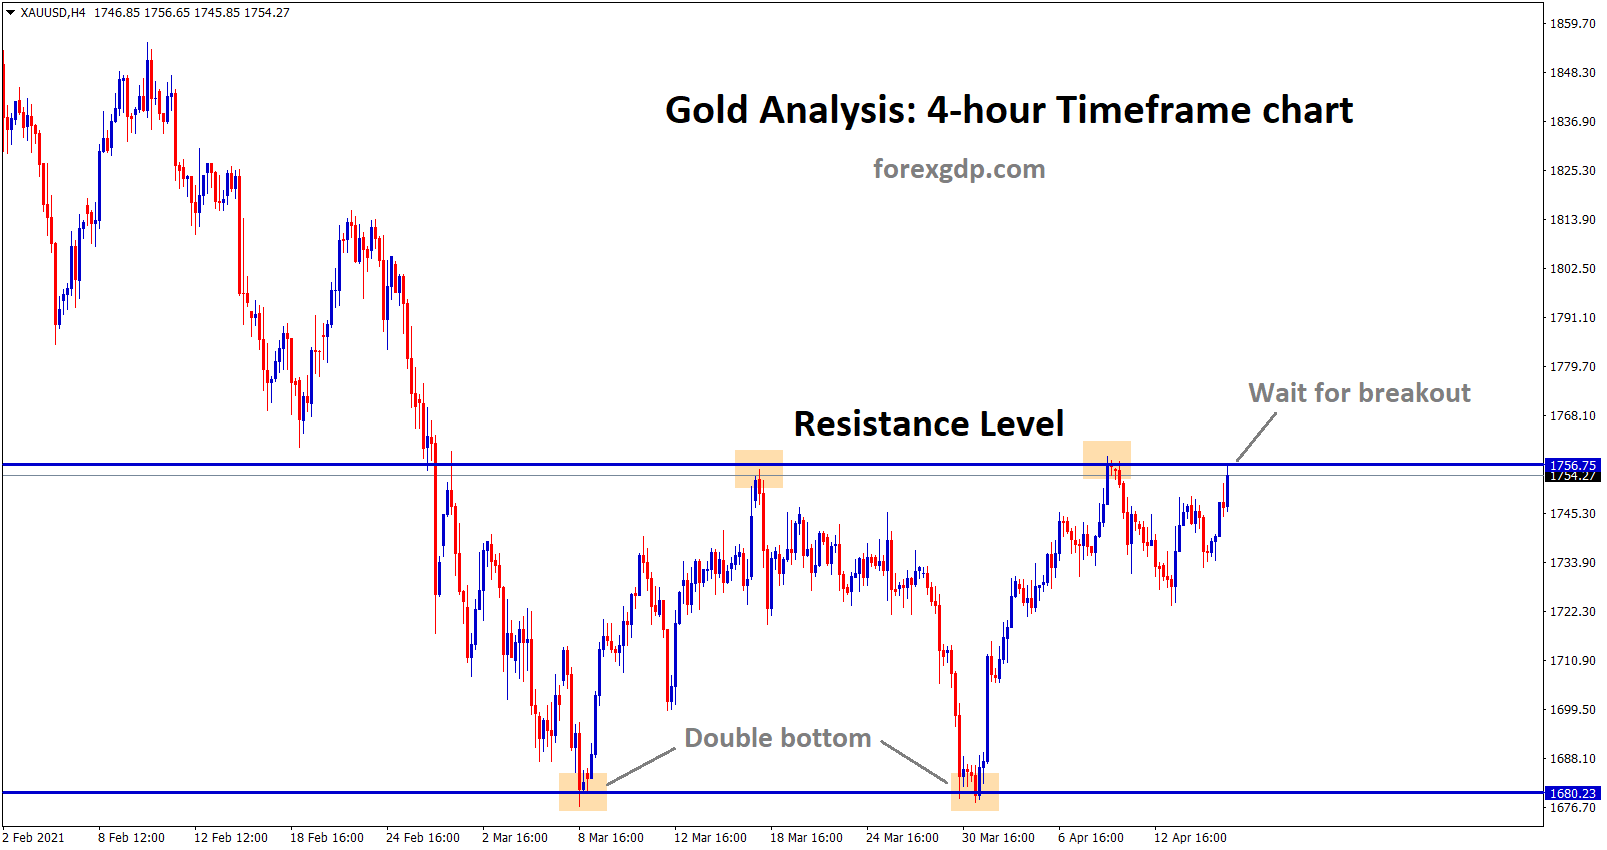
Gold Analysis Gold hits the recent resistance zone now. Let's wait for the confirmation of the breakout. Key points The…
-
Forex Chart Analysis on major currencies

List of currencies with their analysis and Economic news Key Summary USD continues to suffer after the rising inflation rate…
-
Gold going to retest or break the resistance
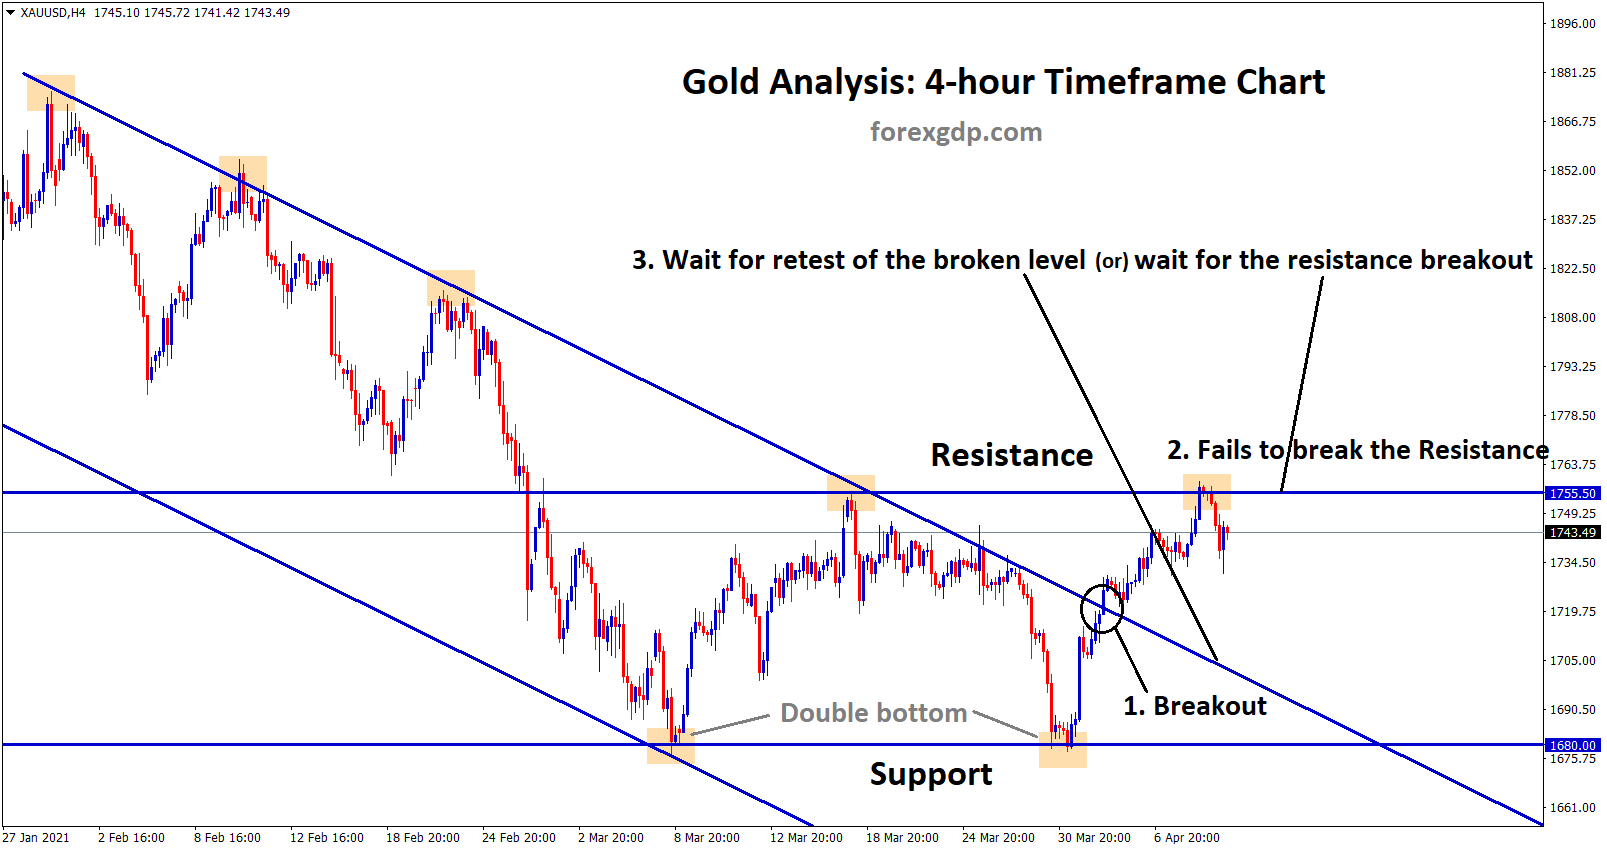
Gold Analysis 1. Gold has broken the top level of the downtrend line after forming the double bottom. 2. Fails…