eurusd long term
-
EURUSD and USDHF inverse correlation chart setup
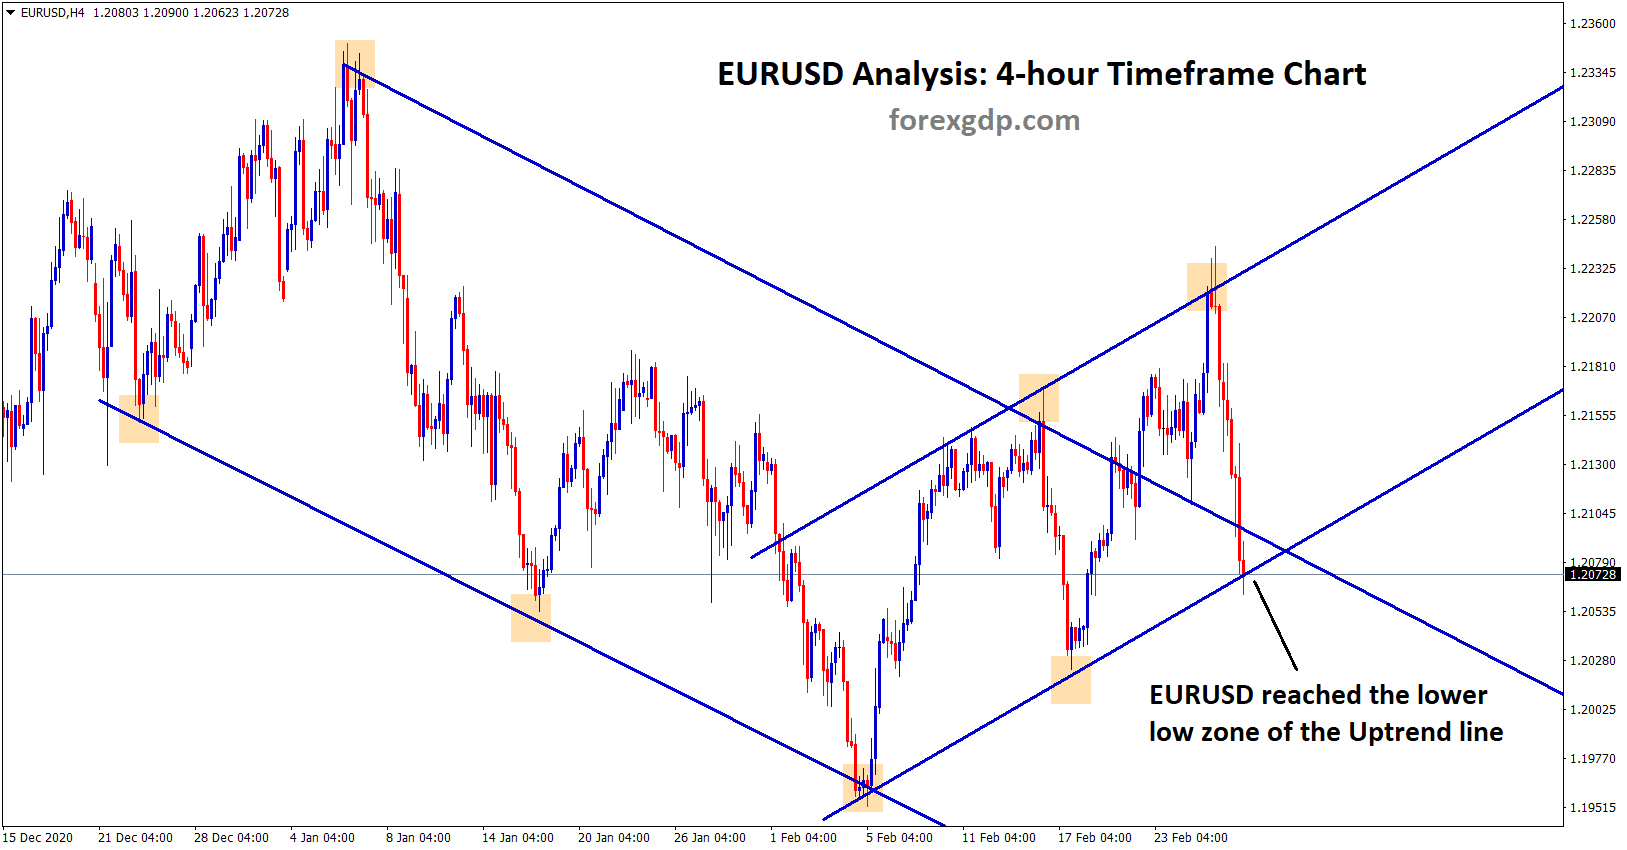
EURUSD and USDCHF Inverse Correlation Analysis EURUSD is standing at the bottom level (higher low) of the trendline. Opposite to…
-
Triangle Patterns are broken in EURUSD and USDCHF
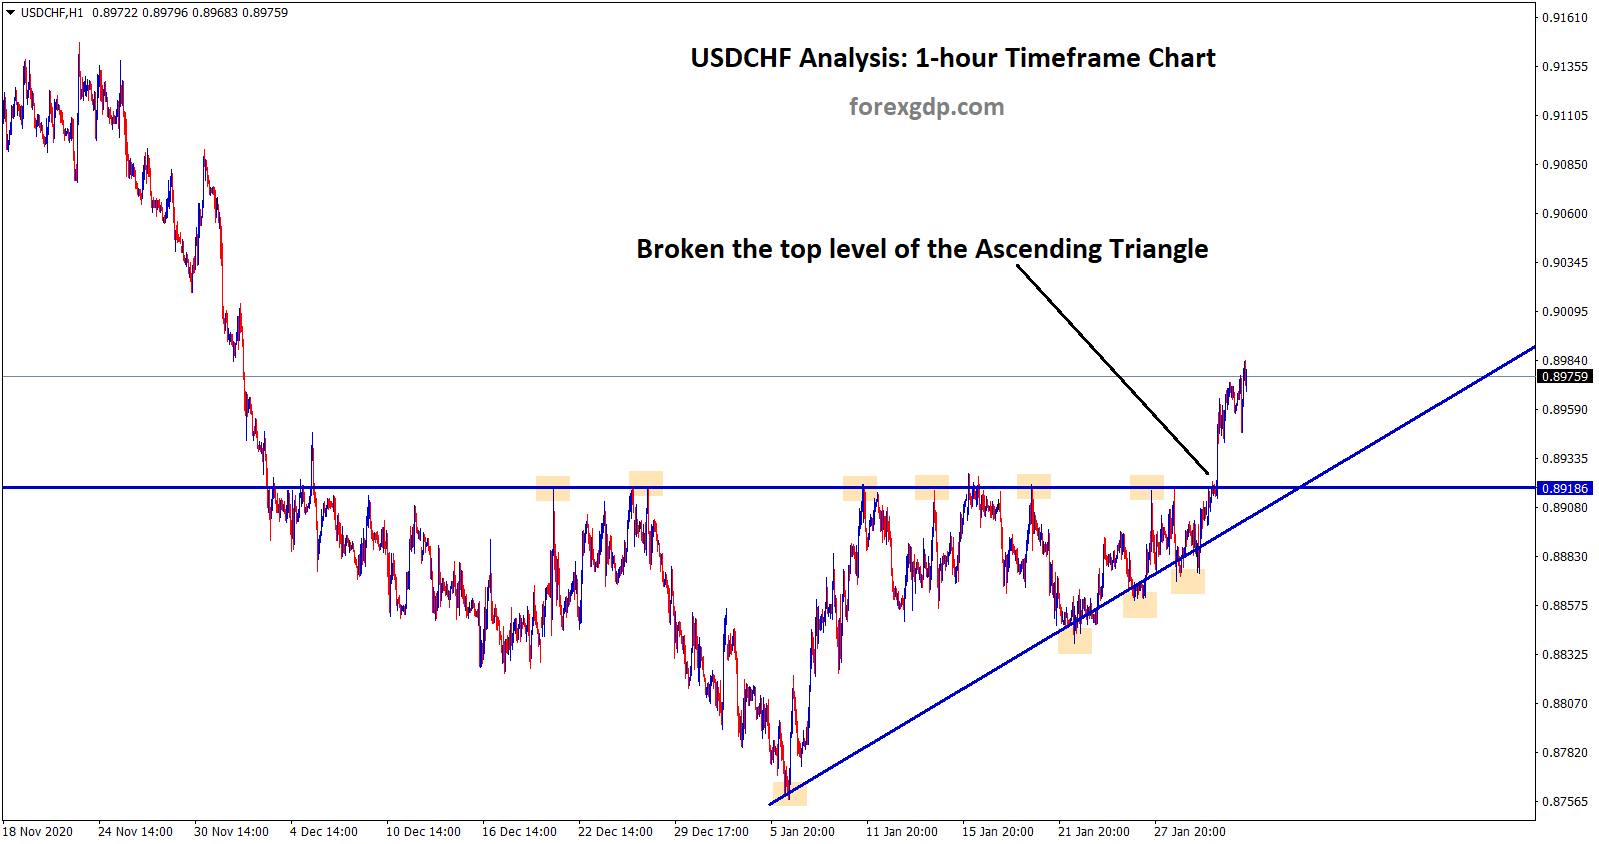
USDCHF Analysis On previous week, we recommend our users to wait for the breakout of this Ascending triangle pattern in…
-
EURUSD has broken the big downtrend line
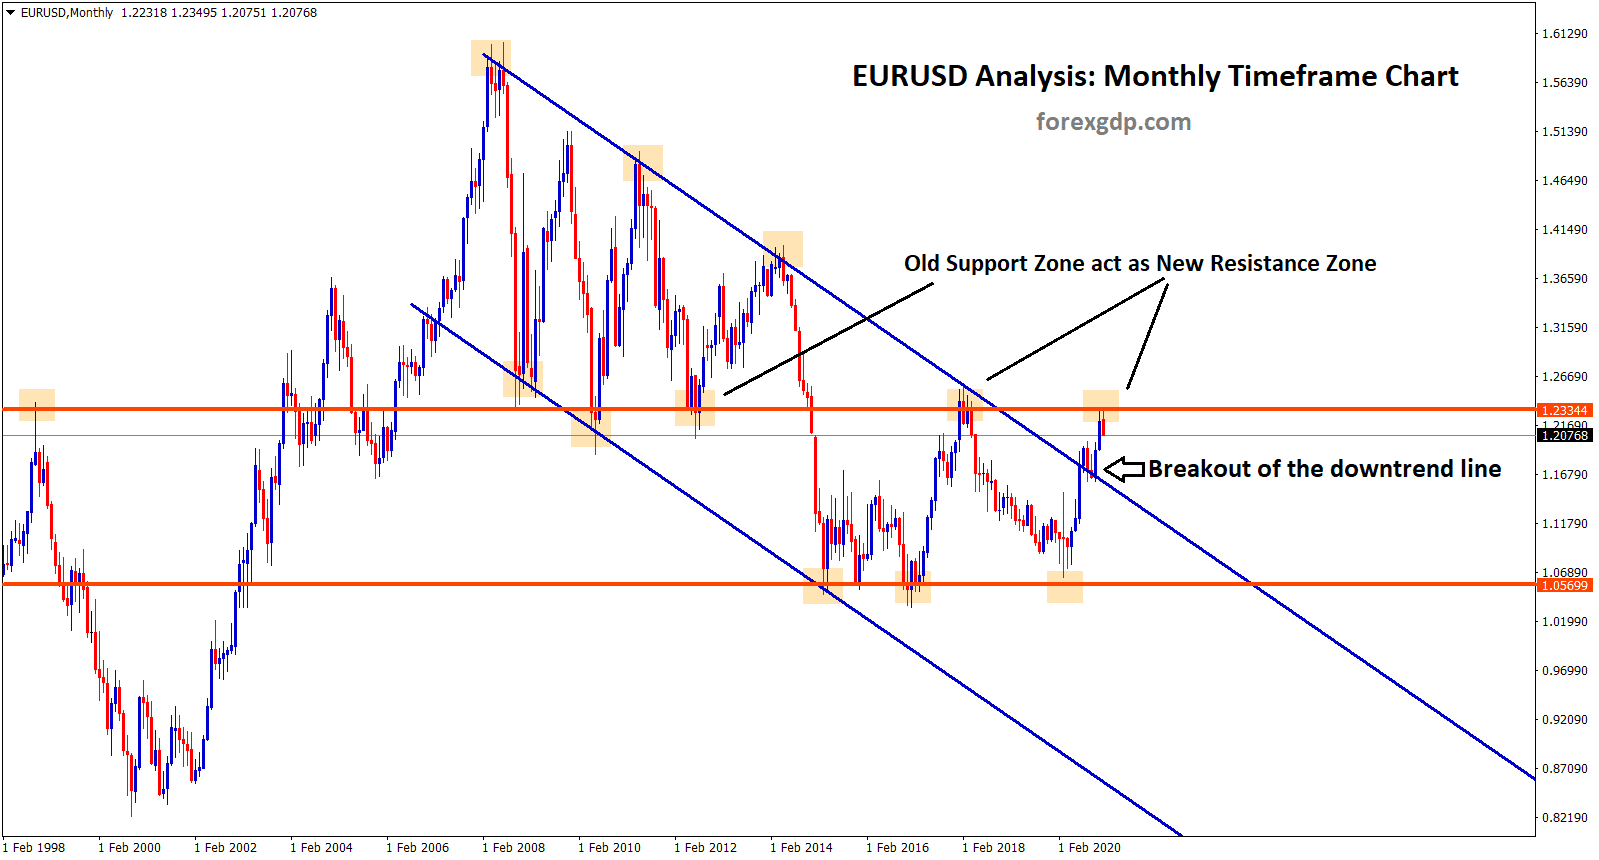
EURUSD Analysis EURUSD has broken the top level of the big downtrend line and now it has reached the resistance…
-
Exactly after 3 months, EURUSD hit this Resistance
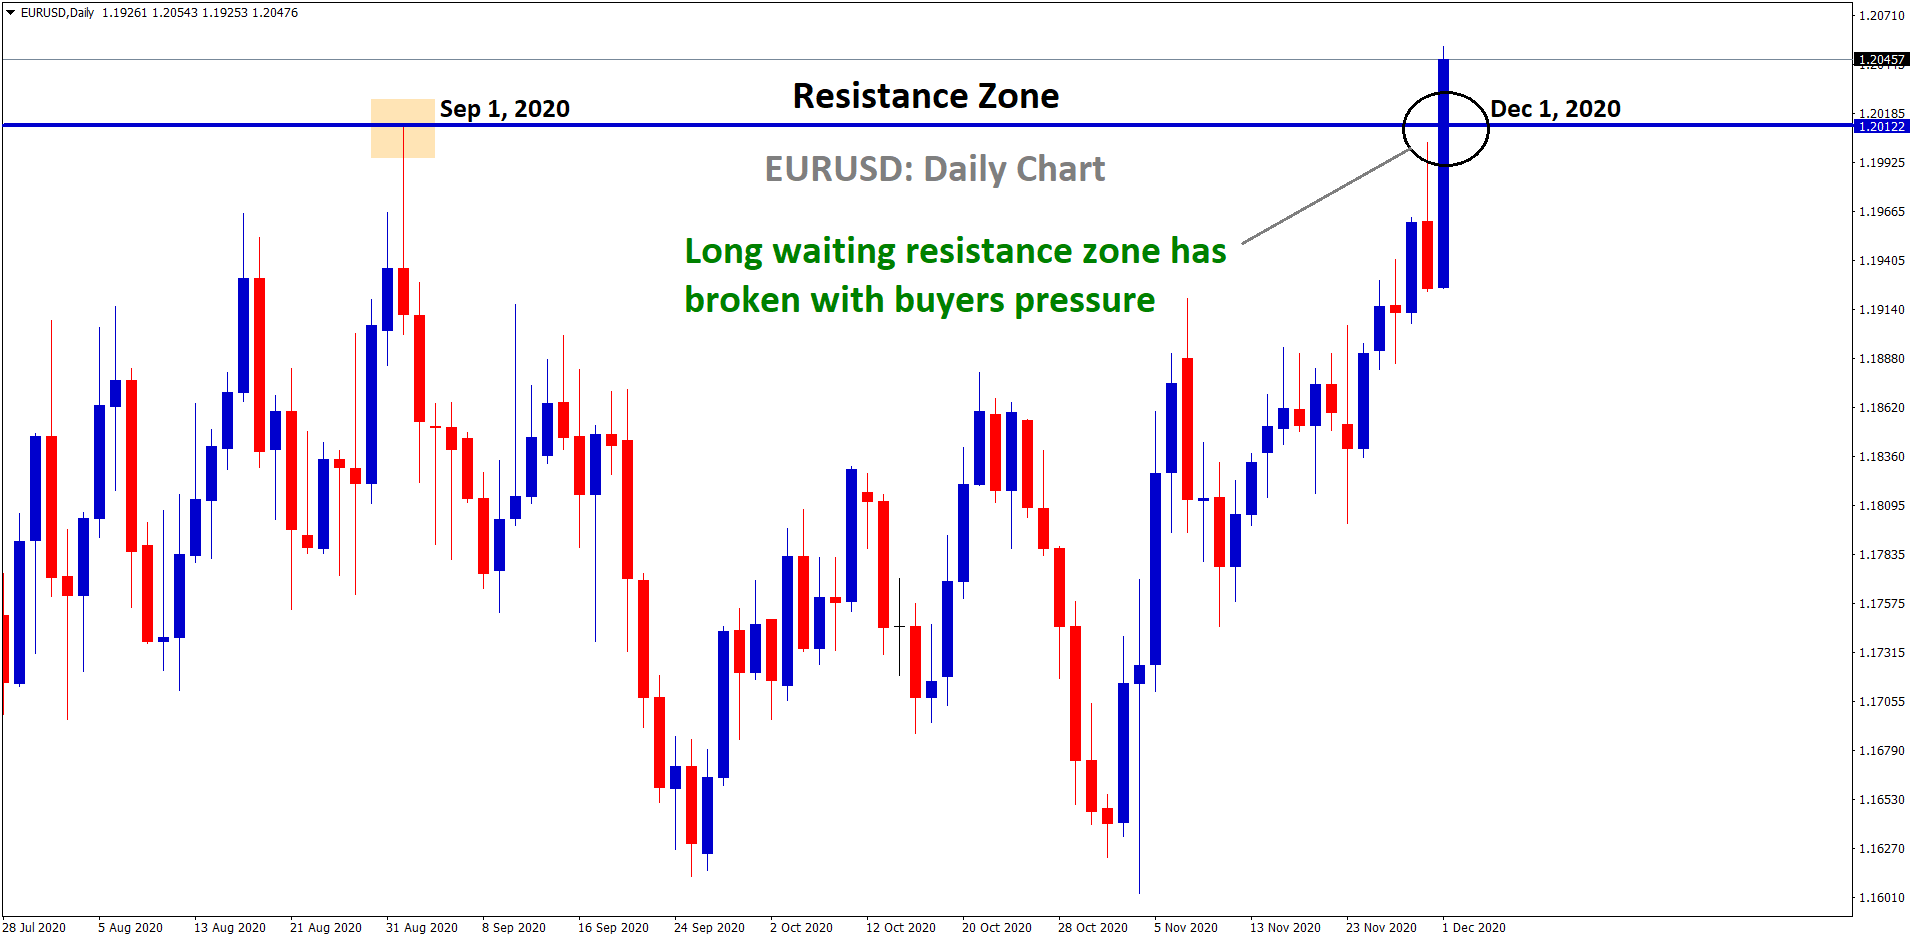
EURUSD Analysis Exactly After 3 months, EURUSD has reached the resistance zone in the daily chart. Today, Breakout has happened…
-
Is EURUSD going to fall?
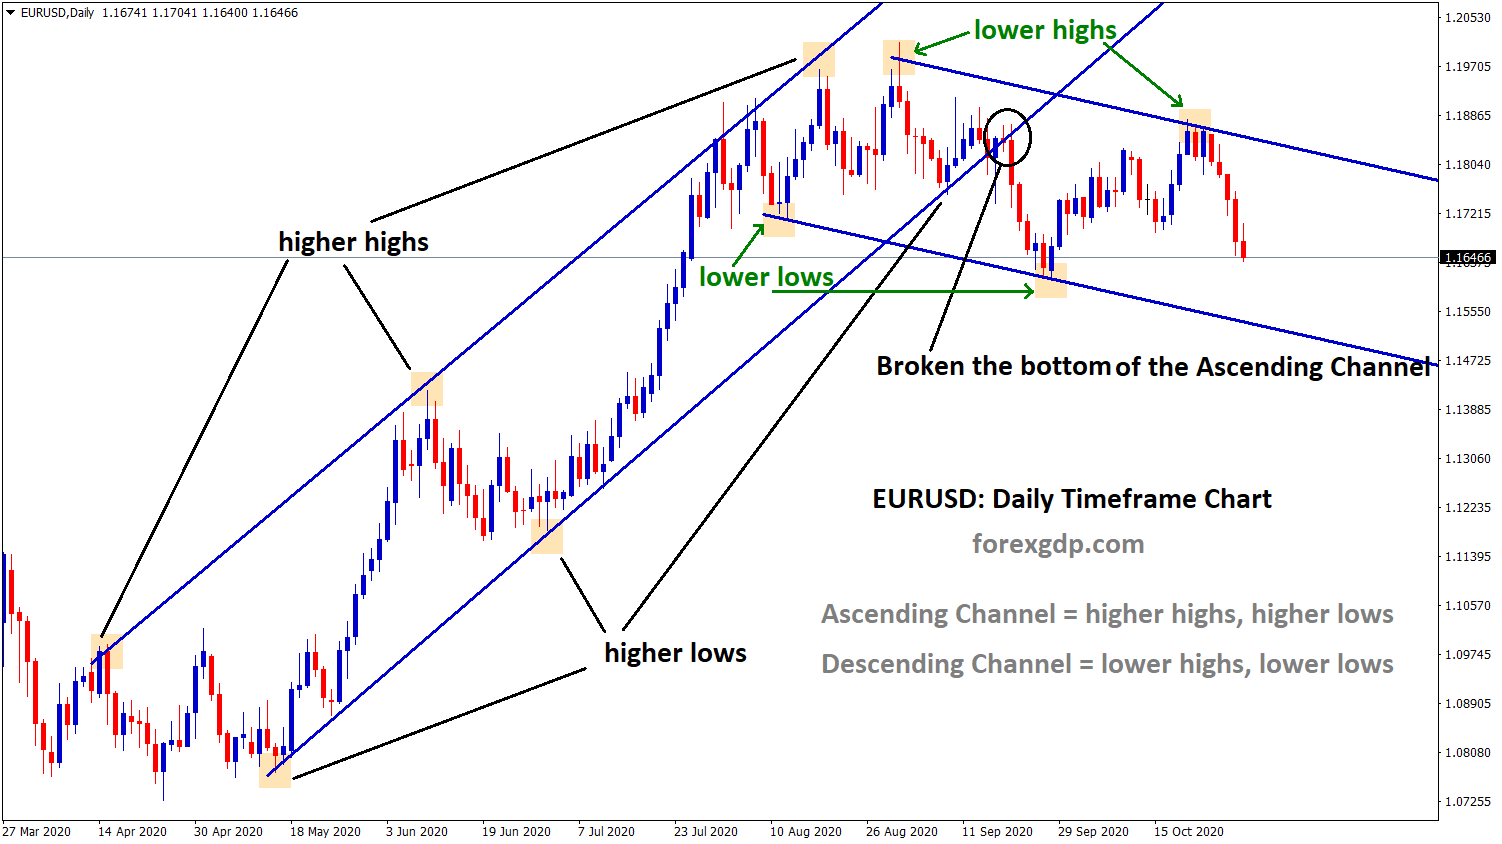
EURUSD has formed both Ascending and Descending channel in the Daily Timeframe Chart. EURUSD has broken the bottom level of…
-
Gold, EURUSD, USDJPY, GBPUSD, USDCHF, NZDUSD Analysis

USDJPY - Both Descending and Ascending Triangle Broken USDJPY has broken the top zone of the Descending Triangle Pattern in the…
-
Trump and Biden’s Poll – Forex Trade Setups to Watch

EURUSD Analysis EURUSD reached the top zone (lower high) of the descending channel. Inflation data for September month will put…
-
EURUSD Uptrend Rally going to start soon after this breakout
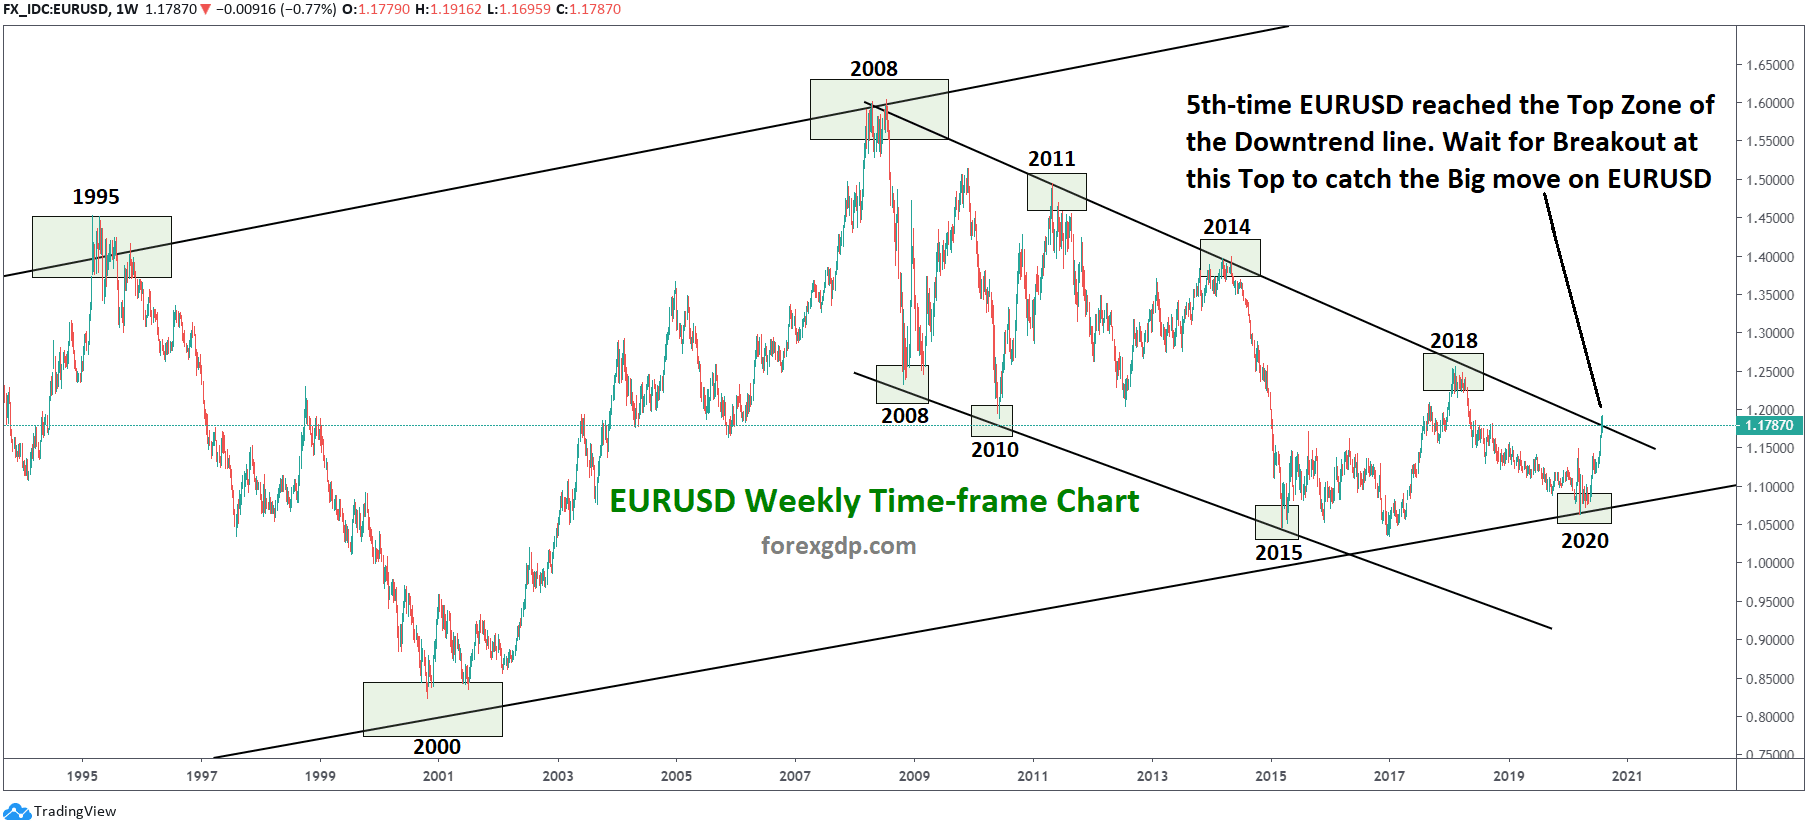
In Weekly Time-frame Chart, Since from the year 2008, EURUSD is moving in a downtrend by forming Lower highs, lower…
-
After 4 months, EURUSD broke the Resistance
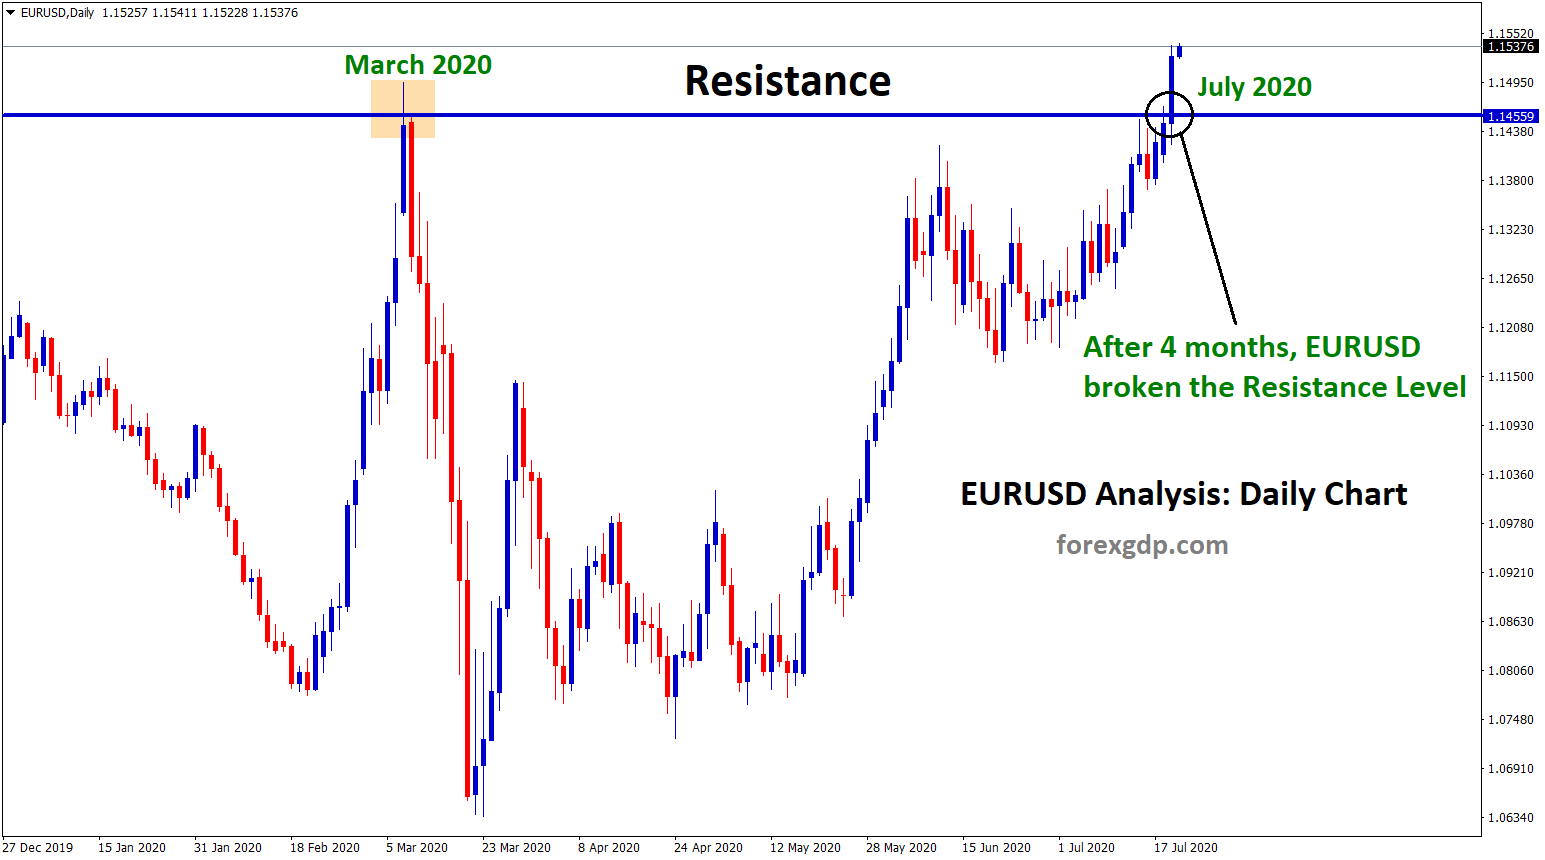
EURUSD Resistance Breakout Analysis After 4 months, EURUSD has broken the resistance zone Steadily with buyers pressure. Due to recovery…
-
Since from 1978, EURUSD moving in an Up Trend

EURUSD History Chart Analysis From the year 1978 to till now in 2020, EURUSD is moving in an Uptrend by…
-
EUR/USD reached the bottom support level after 5 months

EUR/USD is moving in a downtrend for long time in Daily Chart. After 5 months, EUR/USD reached the bottom support…
-
EUR/USD trying to Breakout the Bottom. Is it good to Sell the Breakout ?
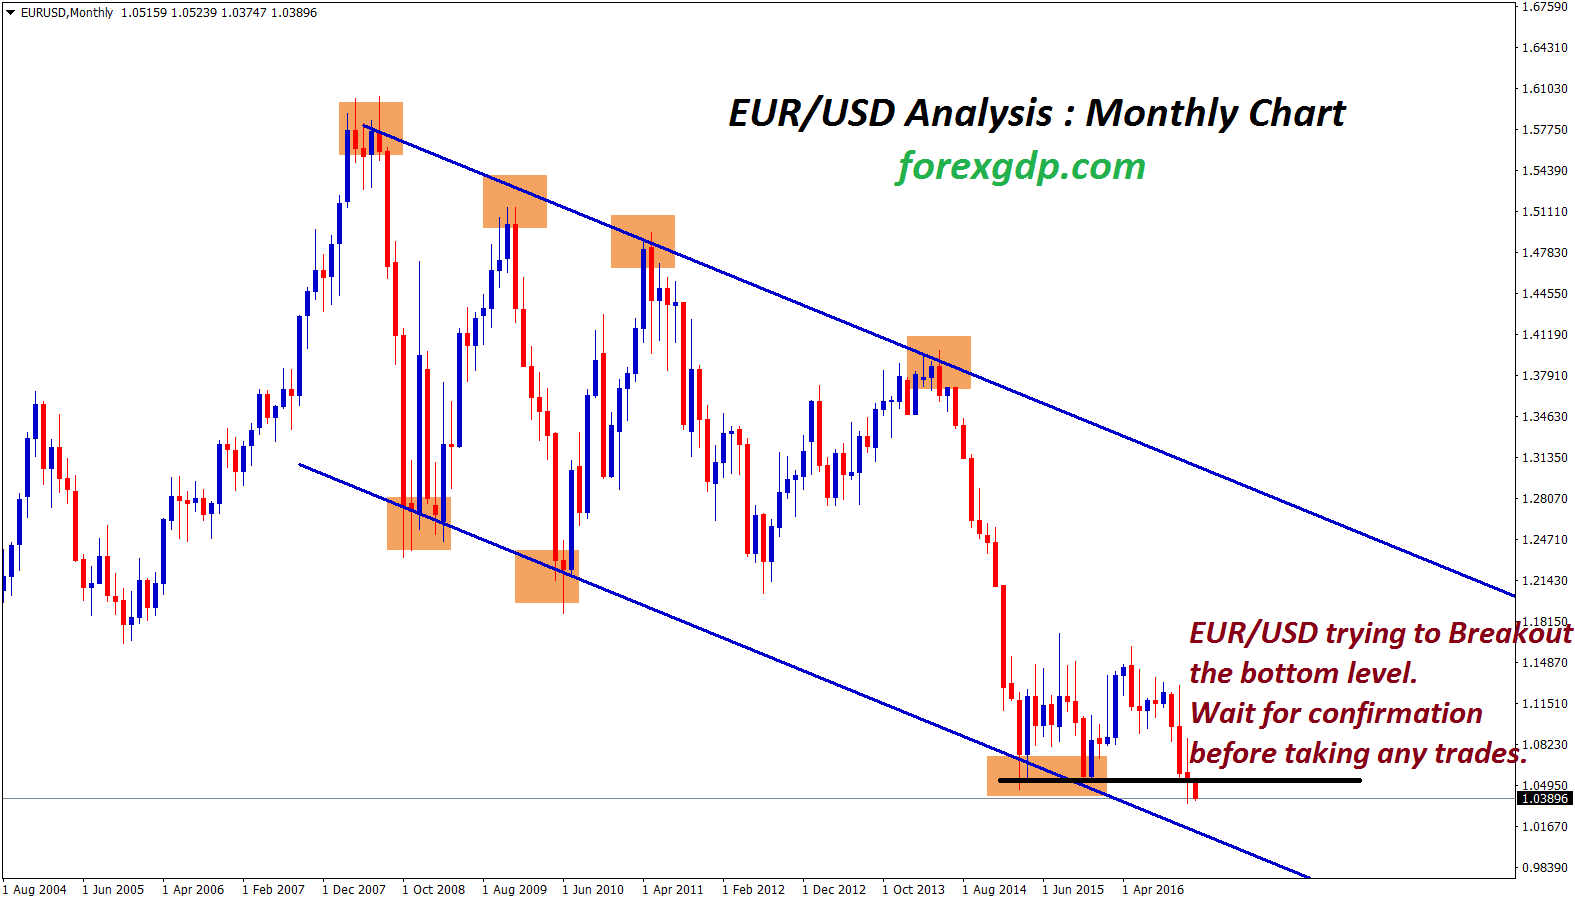
EUR/USD Analysis : After a Big straight downward movement from 1.40 price, the EUR/USD reaches the support zone 1.05 The 1.05…