Trading Results
Check the Forex fundamental and technical analysis for buying and selling of each signals in fx market which helps you to understand why our analyst has given the Buy signals and Sell Signals. Please note : It is better to sit quiet instead of taking wrong trades, we focus on providing you the forex signals only at good trade setup. If you want to test our forex signals, click here to try our free signals. Enjoy watching the best trade setups in forex market. Join Free.
-
Oil Price war ended, Boris Recovered from coronavirus

Oil price war - Opec secures record global oil cuts under US pressure On Sunday, Saudi Arabia and Russia Ended…
-
Gold Reach New highs 1710 USD per barrel

Gold XAUUSD High Low Analysis Gold reach the new high today after 1 month. Gold made a fast recovery from…
-
CADJPY – Old resistance acting as new support
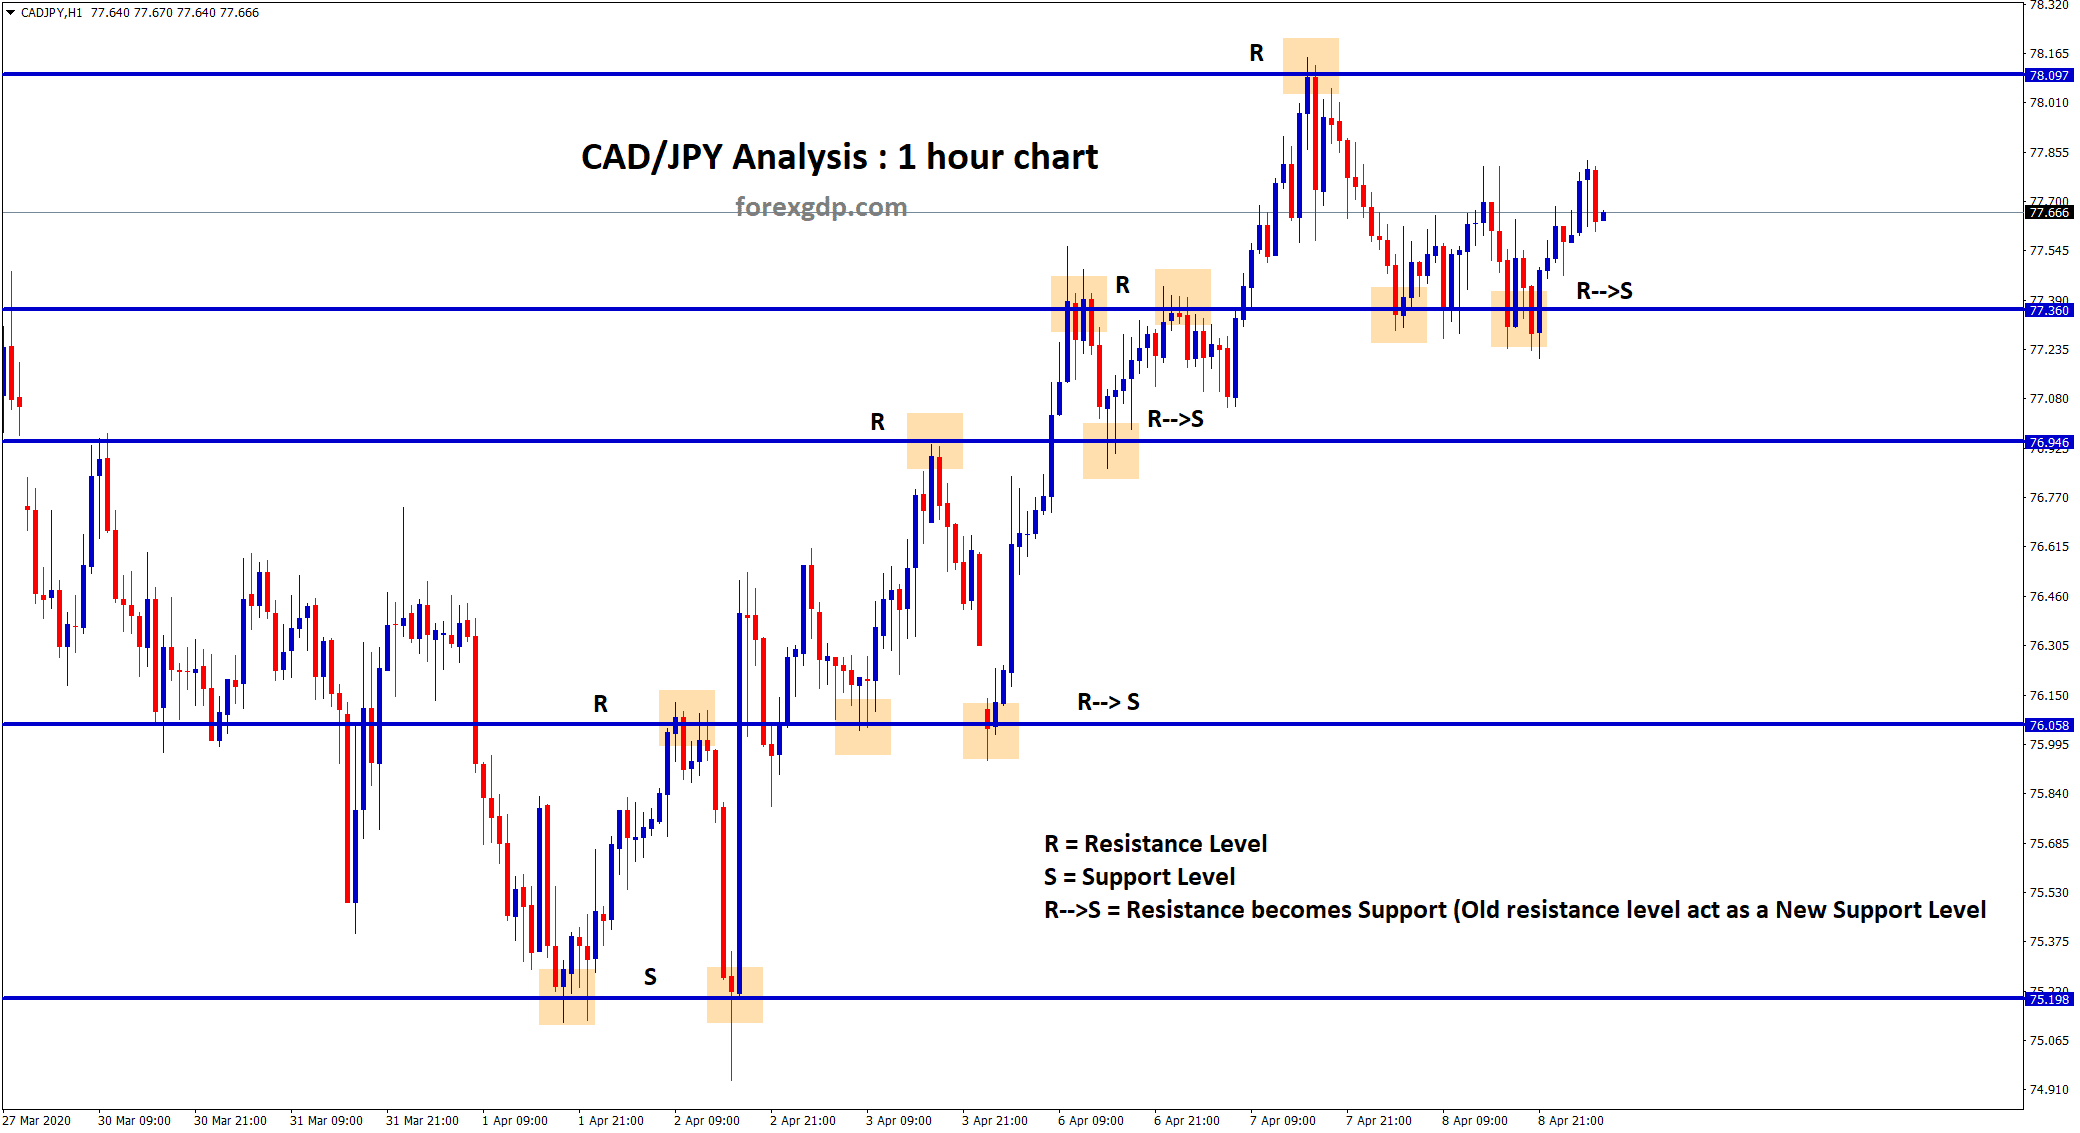
CADJPY forex analysis in different timeframe CADJPY moving up and down by making sideways movement between the resistance and support…
-
EURGBP hits the major level where reversal happened often

EURGBP moving in Sideways trend now In 1 hour chart, EURGBP moving in Sideways and now it hits the support…
-
USDJPY shows “Upside” in both h4, h1 chart
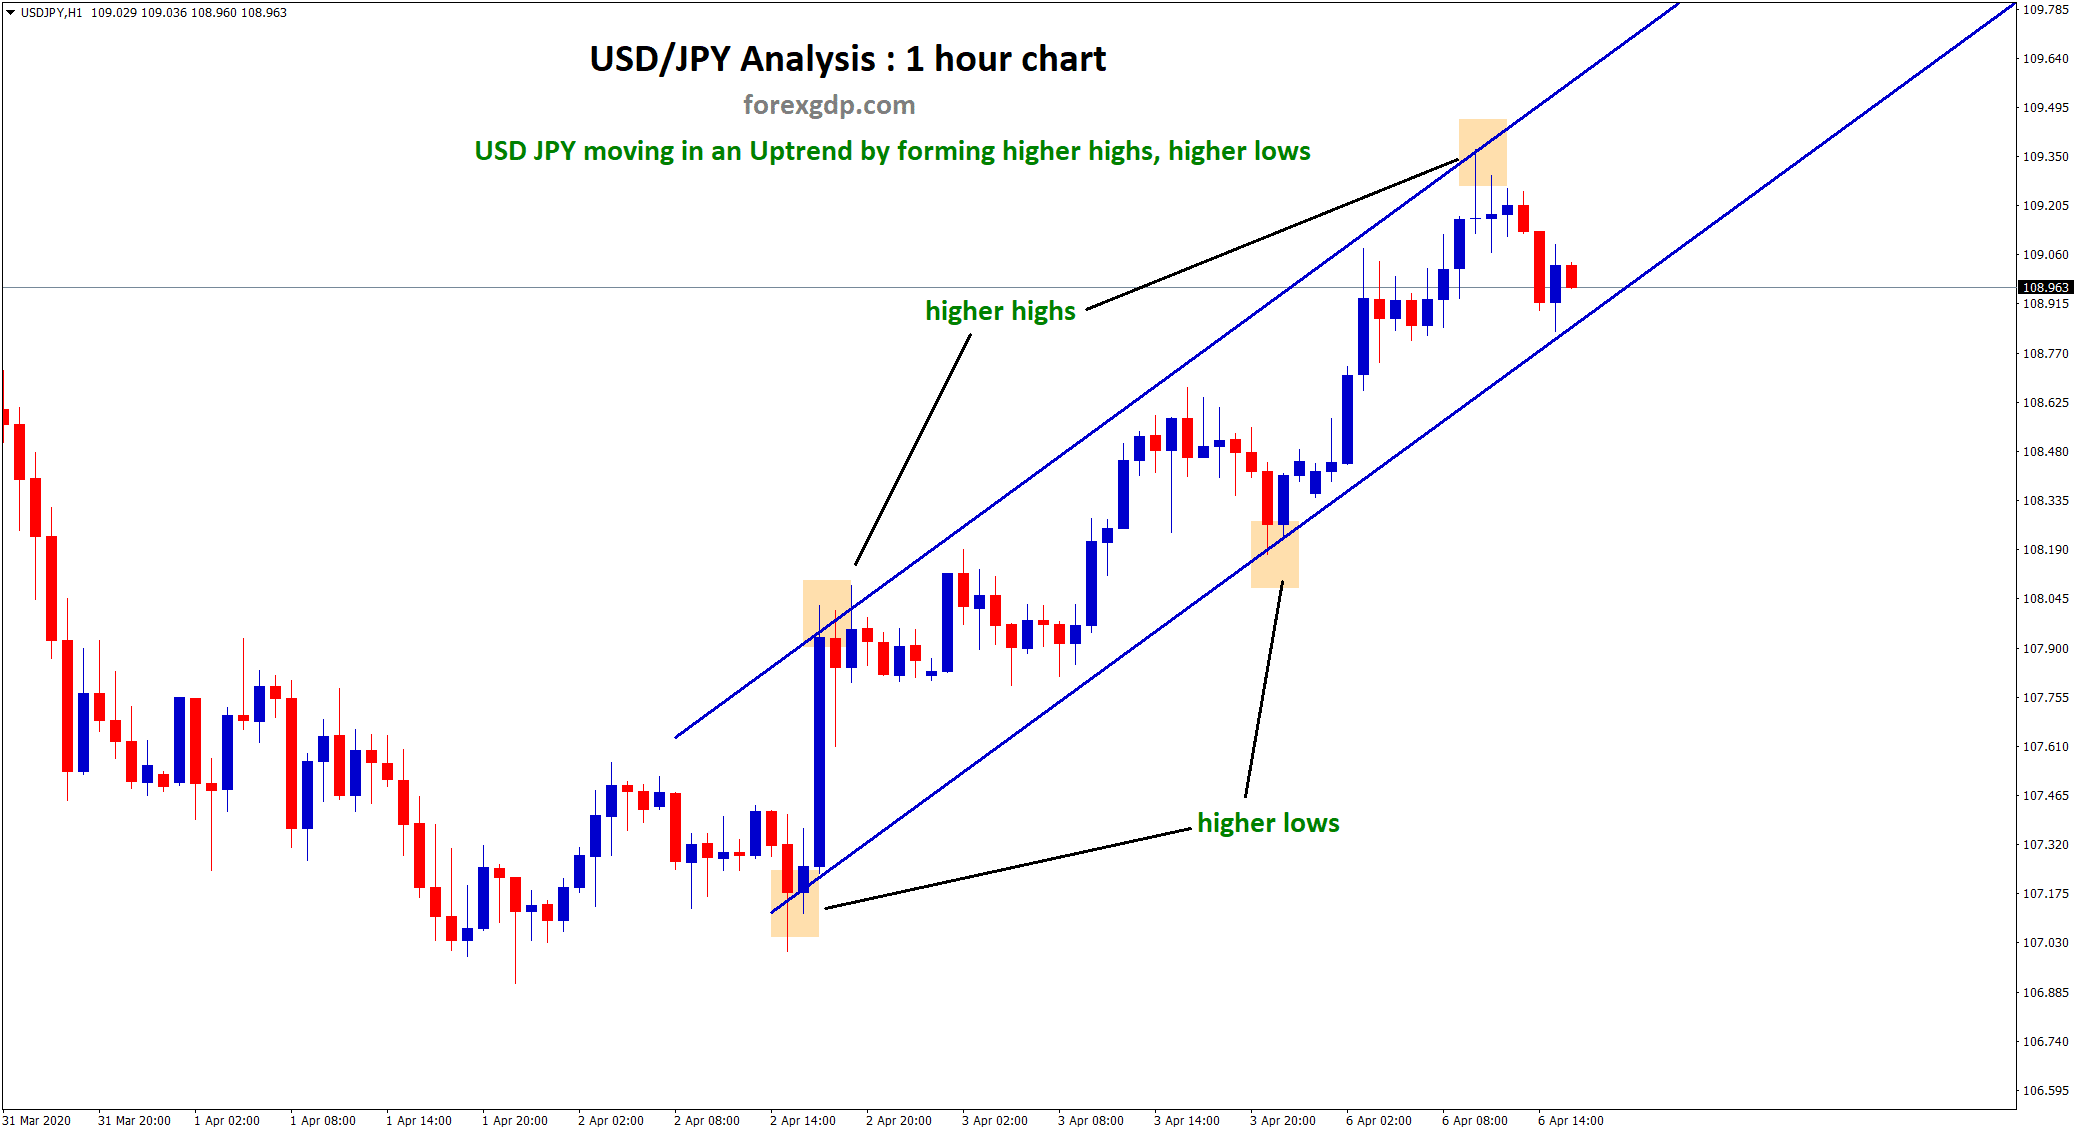
Forex USDJPY Technical Chart Analysis USDJPY is moving in an Uptrend now by forming higher highs, higher lows in 1…
-
AUD JPY landed in Strong Support Zone
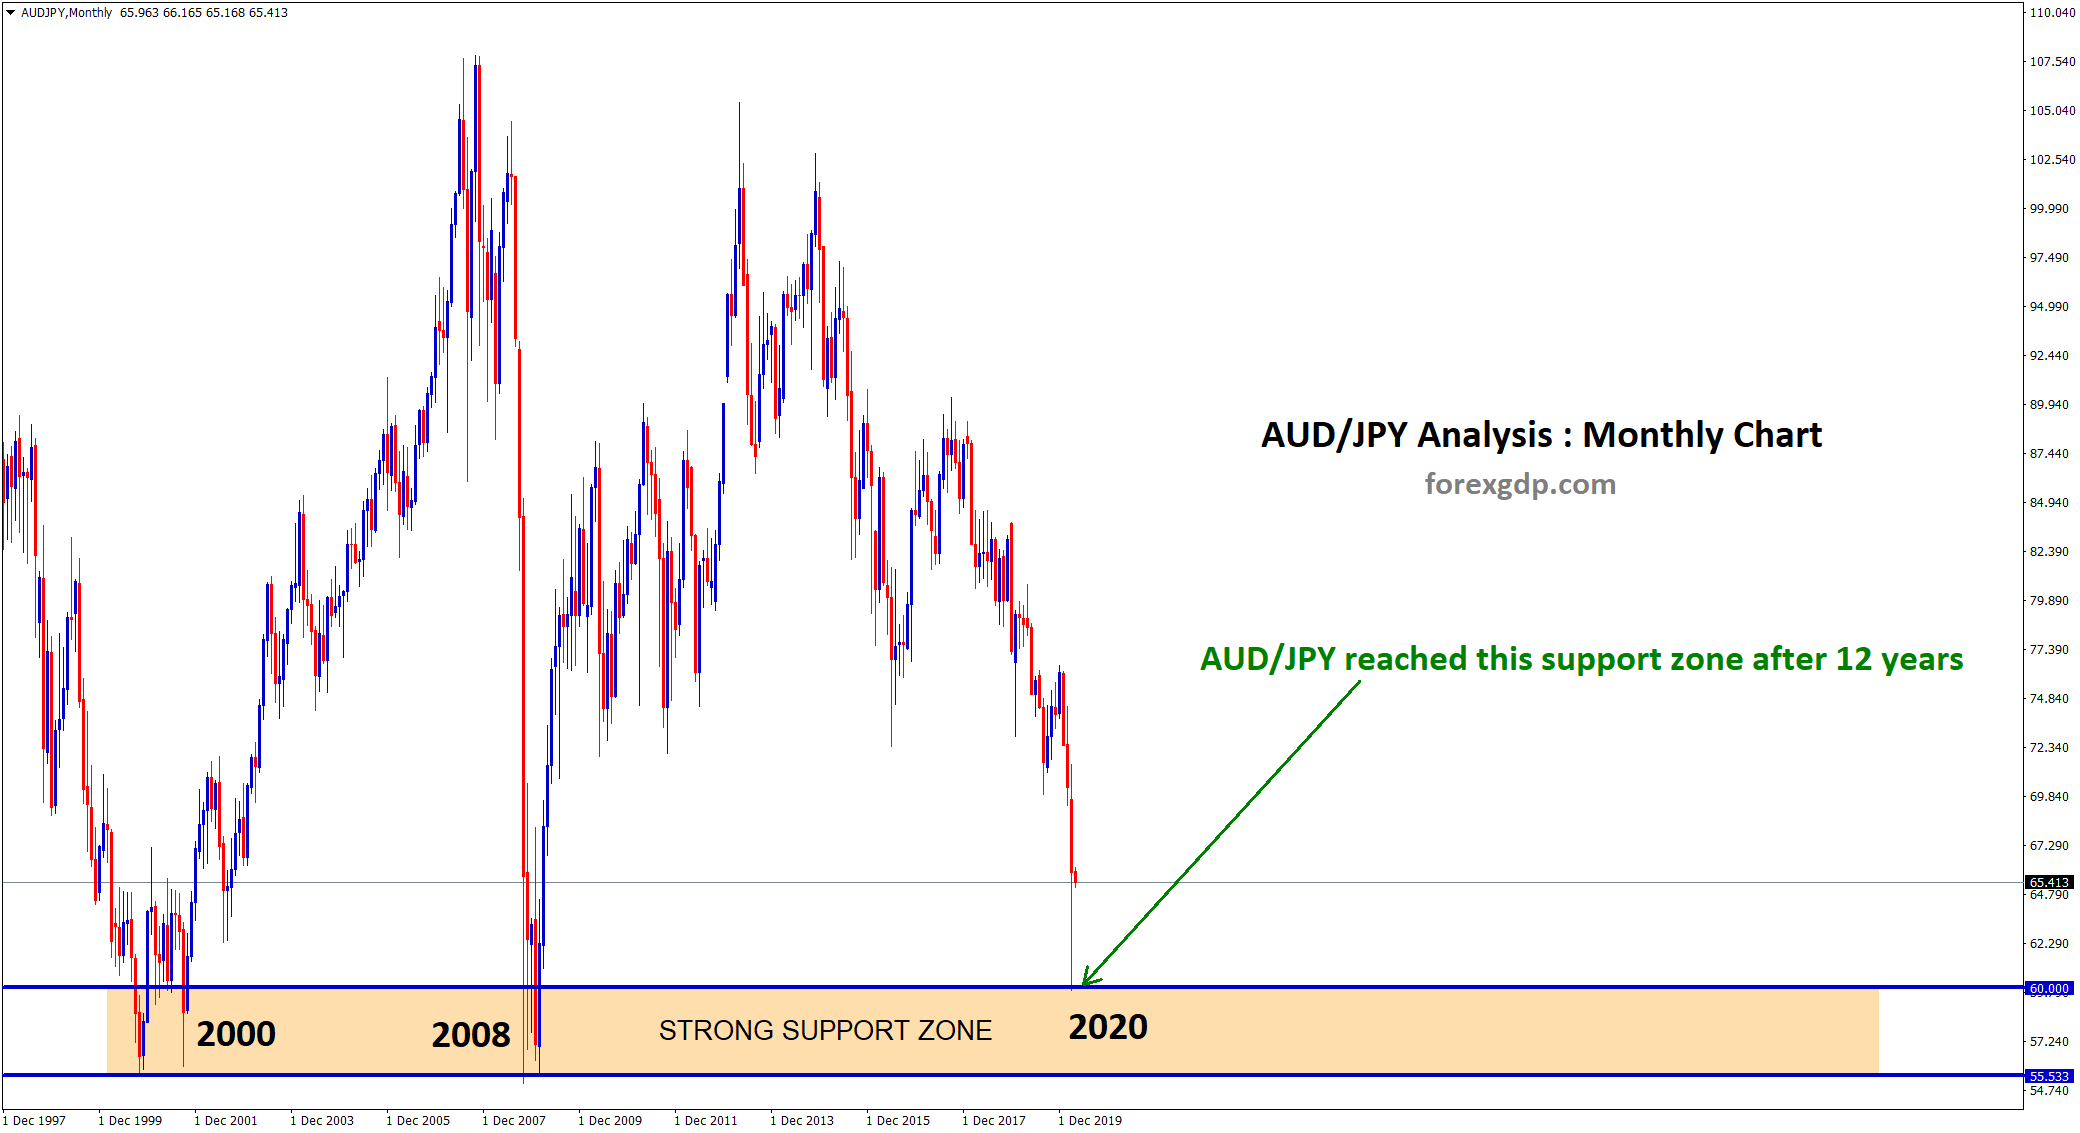
AUD JPY Technical trade analysis After 12 years, AUD JPY reached the strong support zone. In the year 2000, market…
-
After 18 years, crude oil hit this low price

Crude Oil Price Analysis with Technical Chart After 2002, latest analysis shows Crude oil hit this bottom price level now…
-
Free online coronavirus test to know your infection

“Coronavirus Risk Scan by Apollo hospital is designed to decrease the paranoia by generating a risk score based on your…
-
USD CAD hit 4 years high. Double Top forming ?
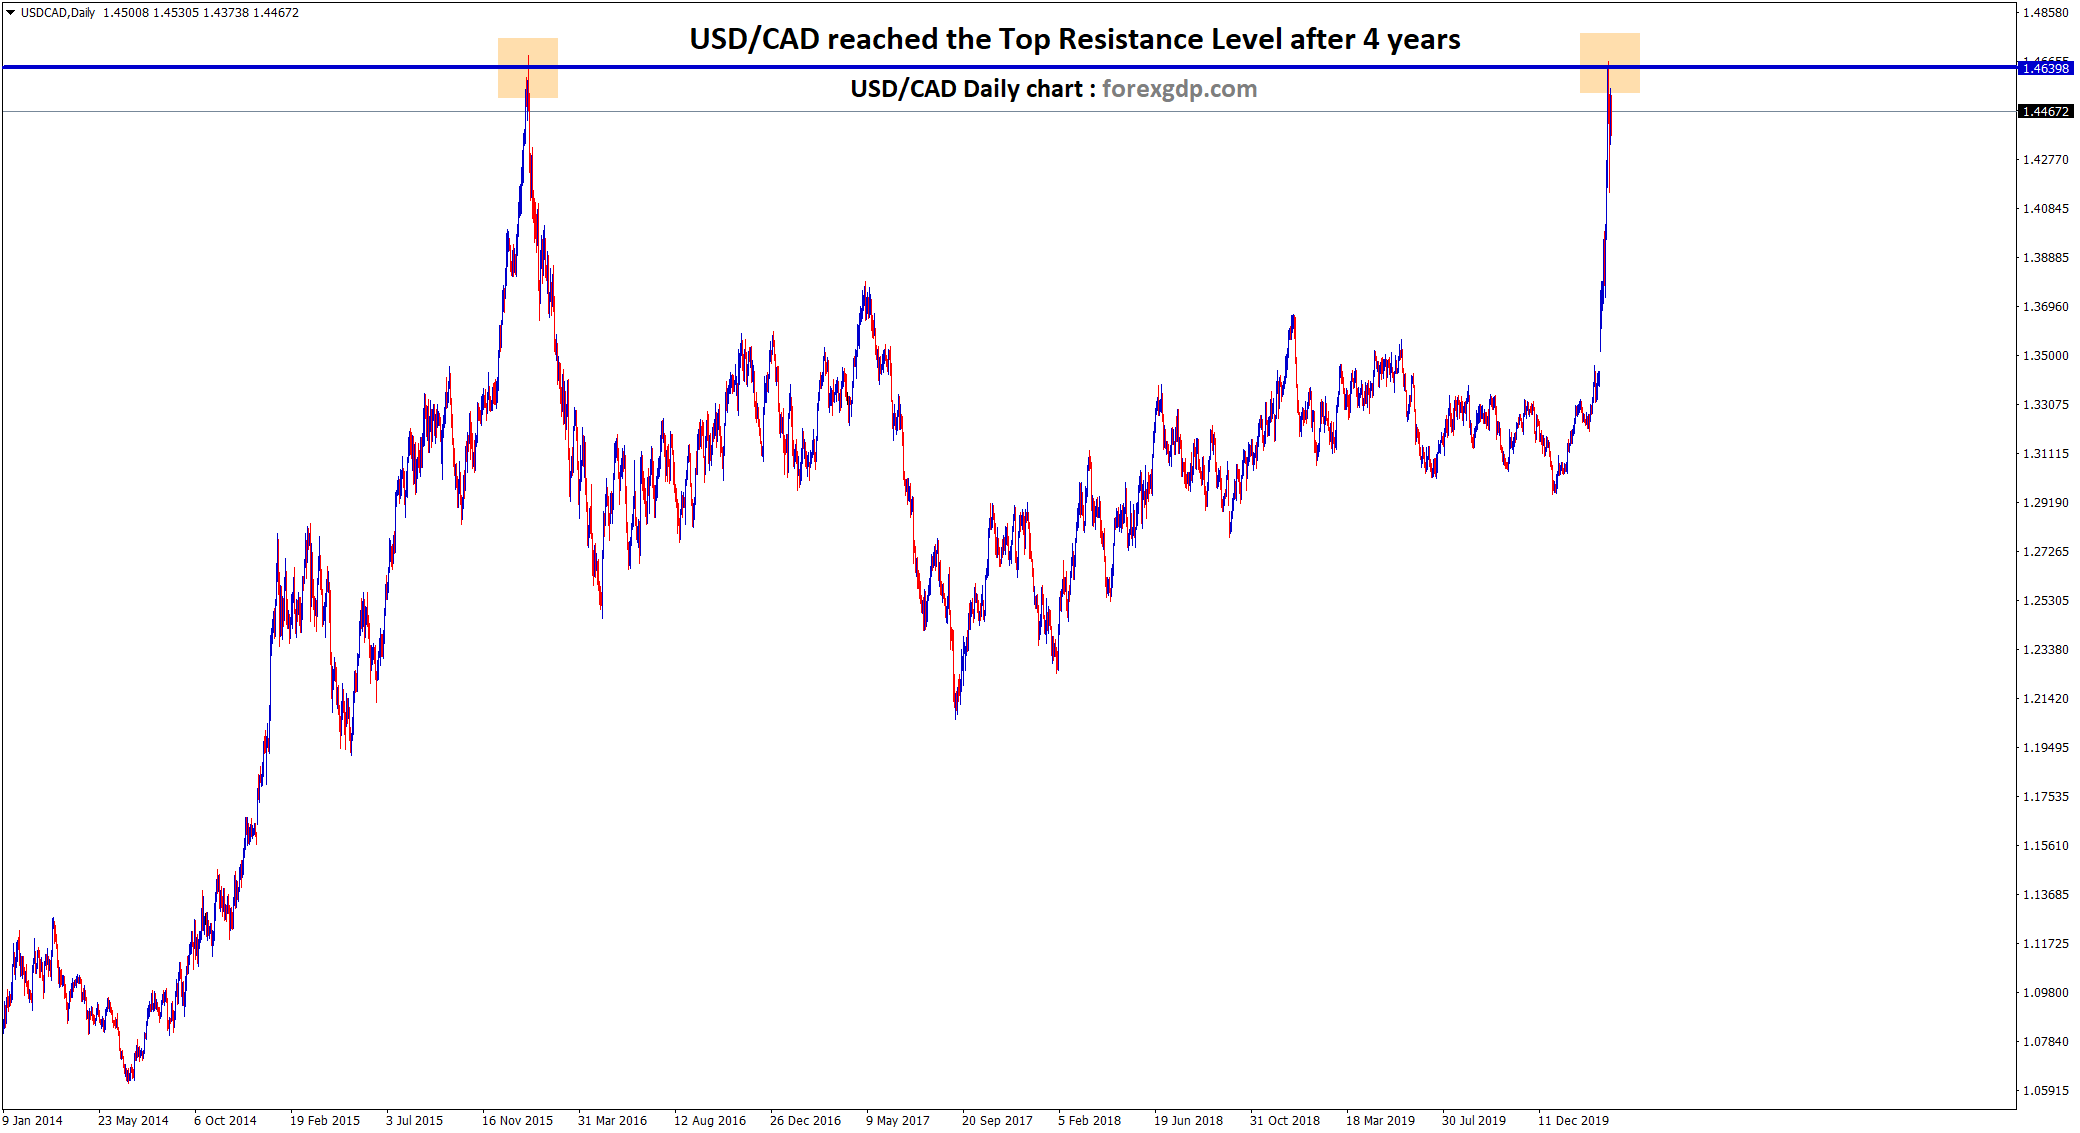
USD CAD creates a Double Top in the Daily chart Expecting a big fall soon. After 4 years, the market…
-
EUR/GBP went up +9489 points from Support level in few days
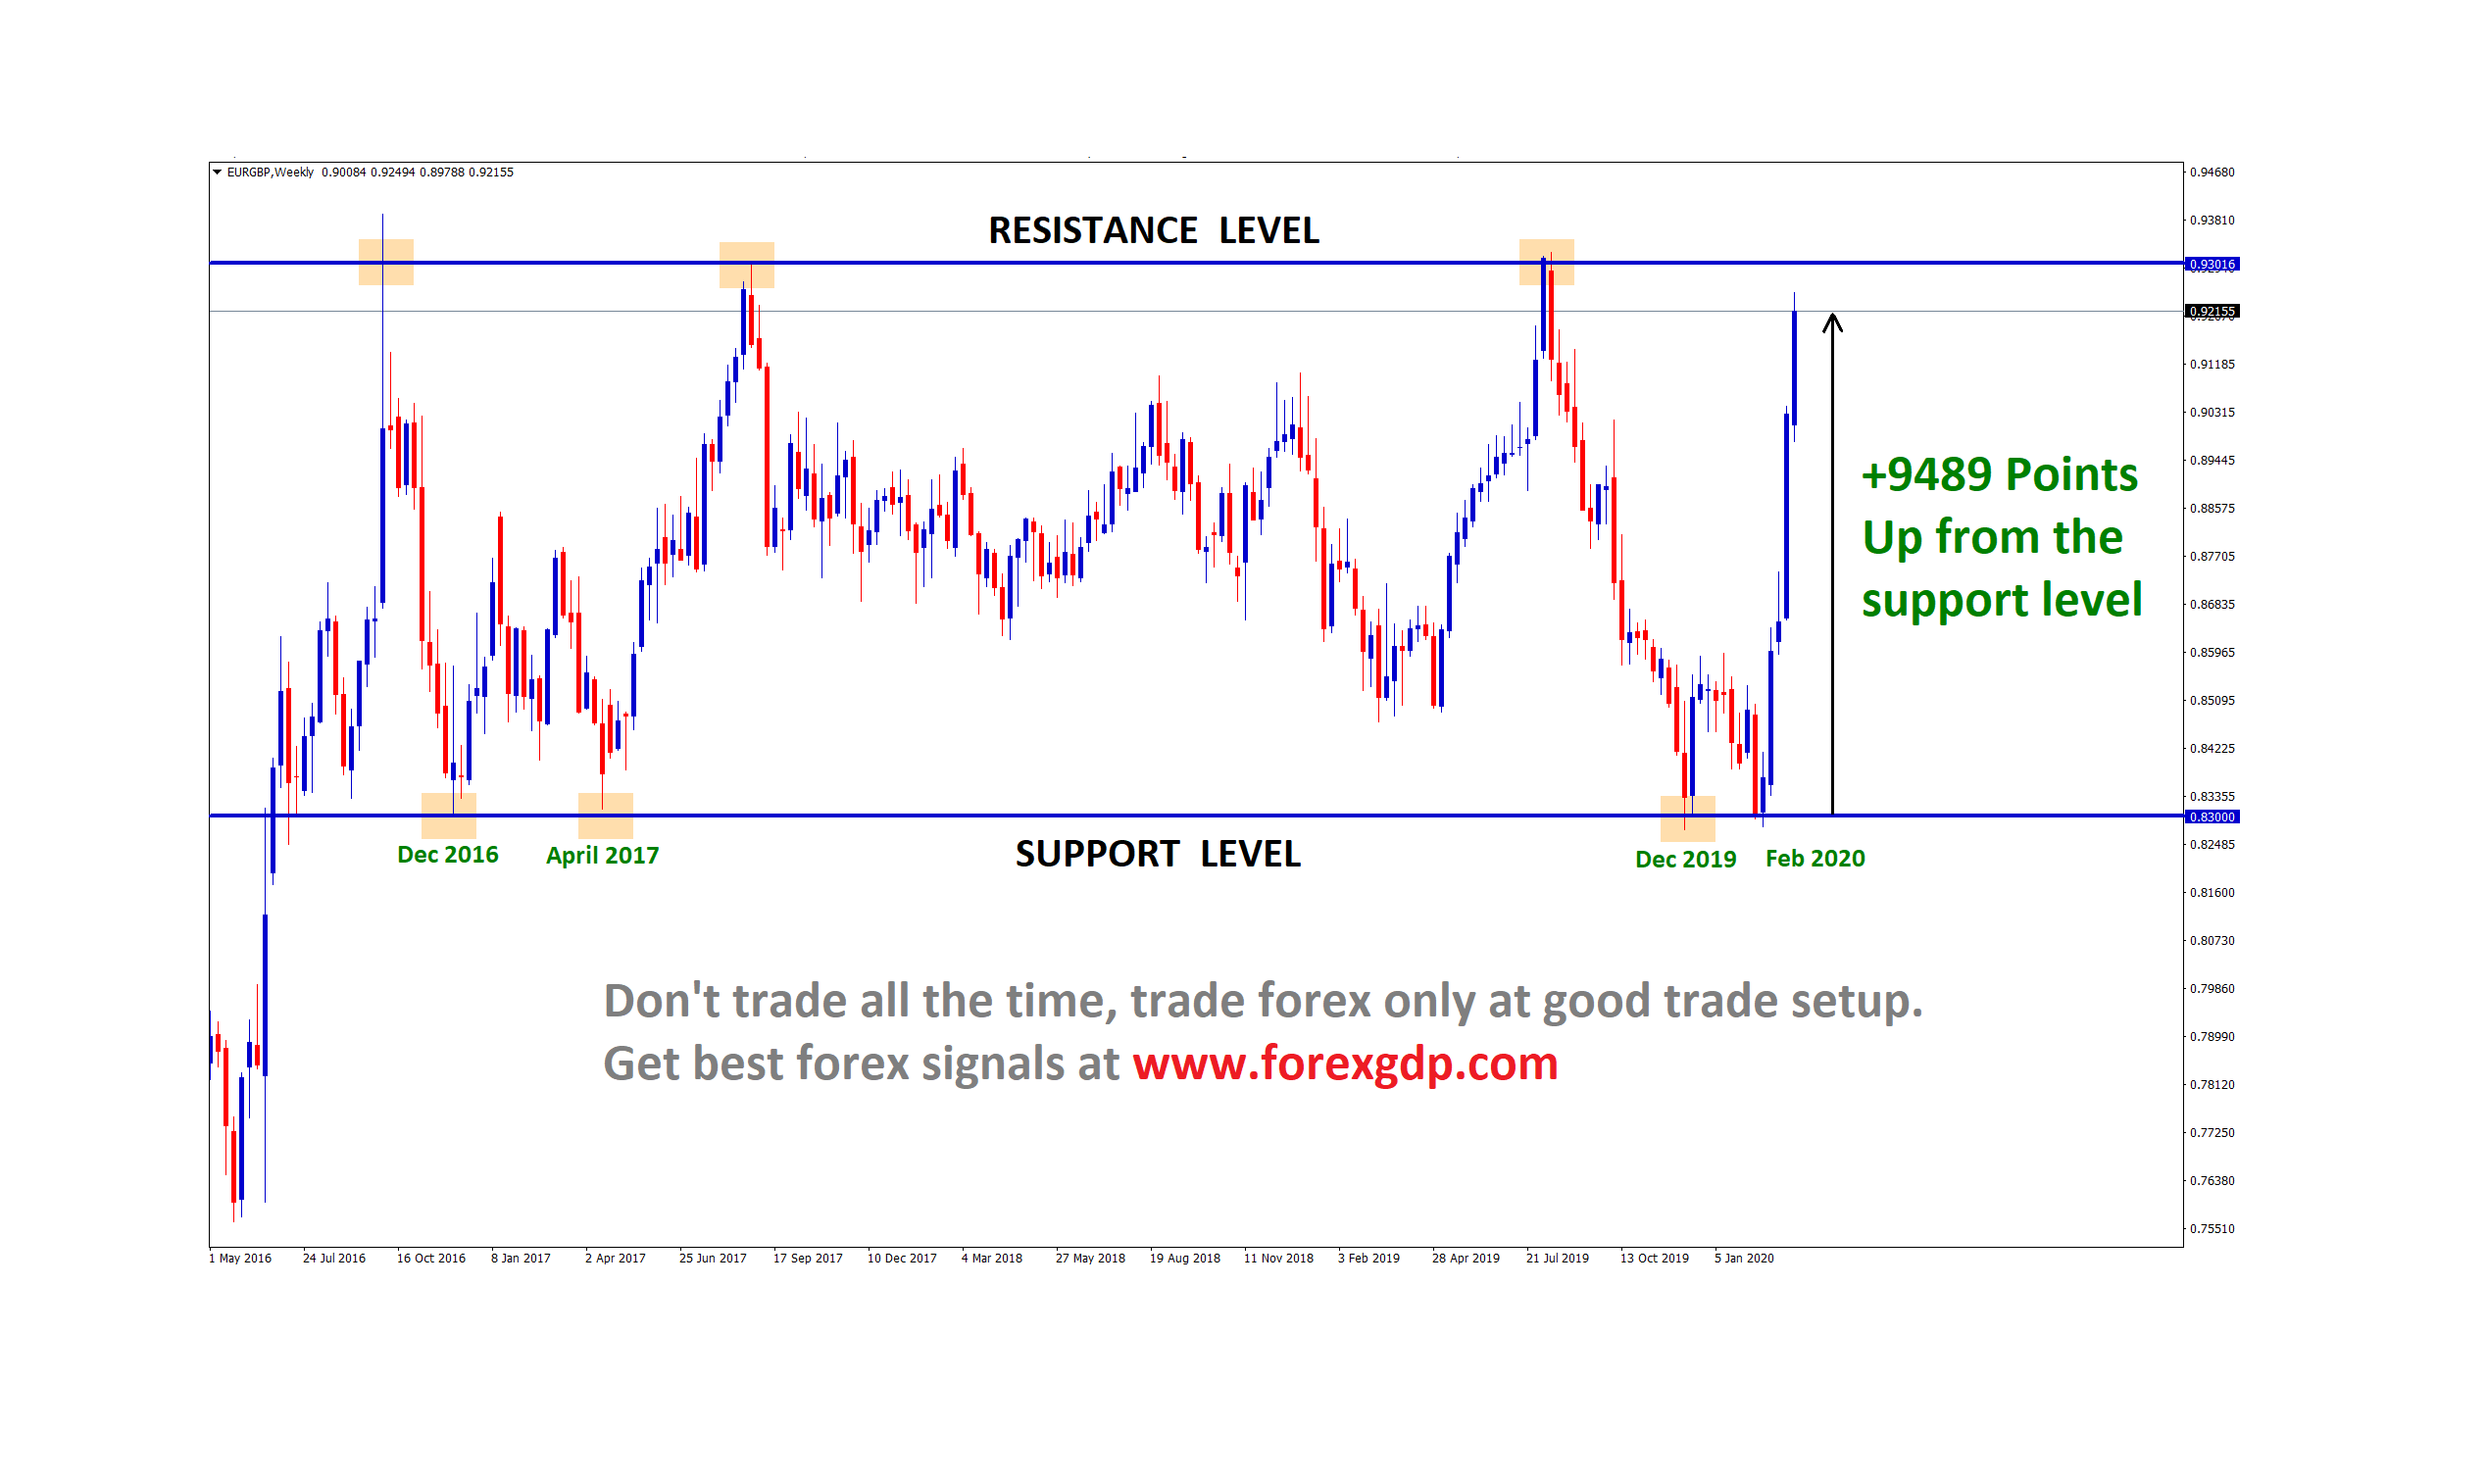
EUR/GBP Technical Support trade analysis update As per our previous EUR/GBP Analysis updates, we recommend all viewers to wait for…
-
AUD/NZD hits 5 year low. Good to Buy?
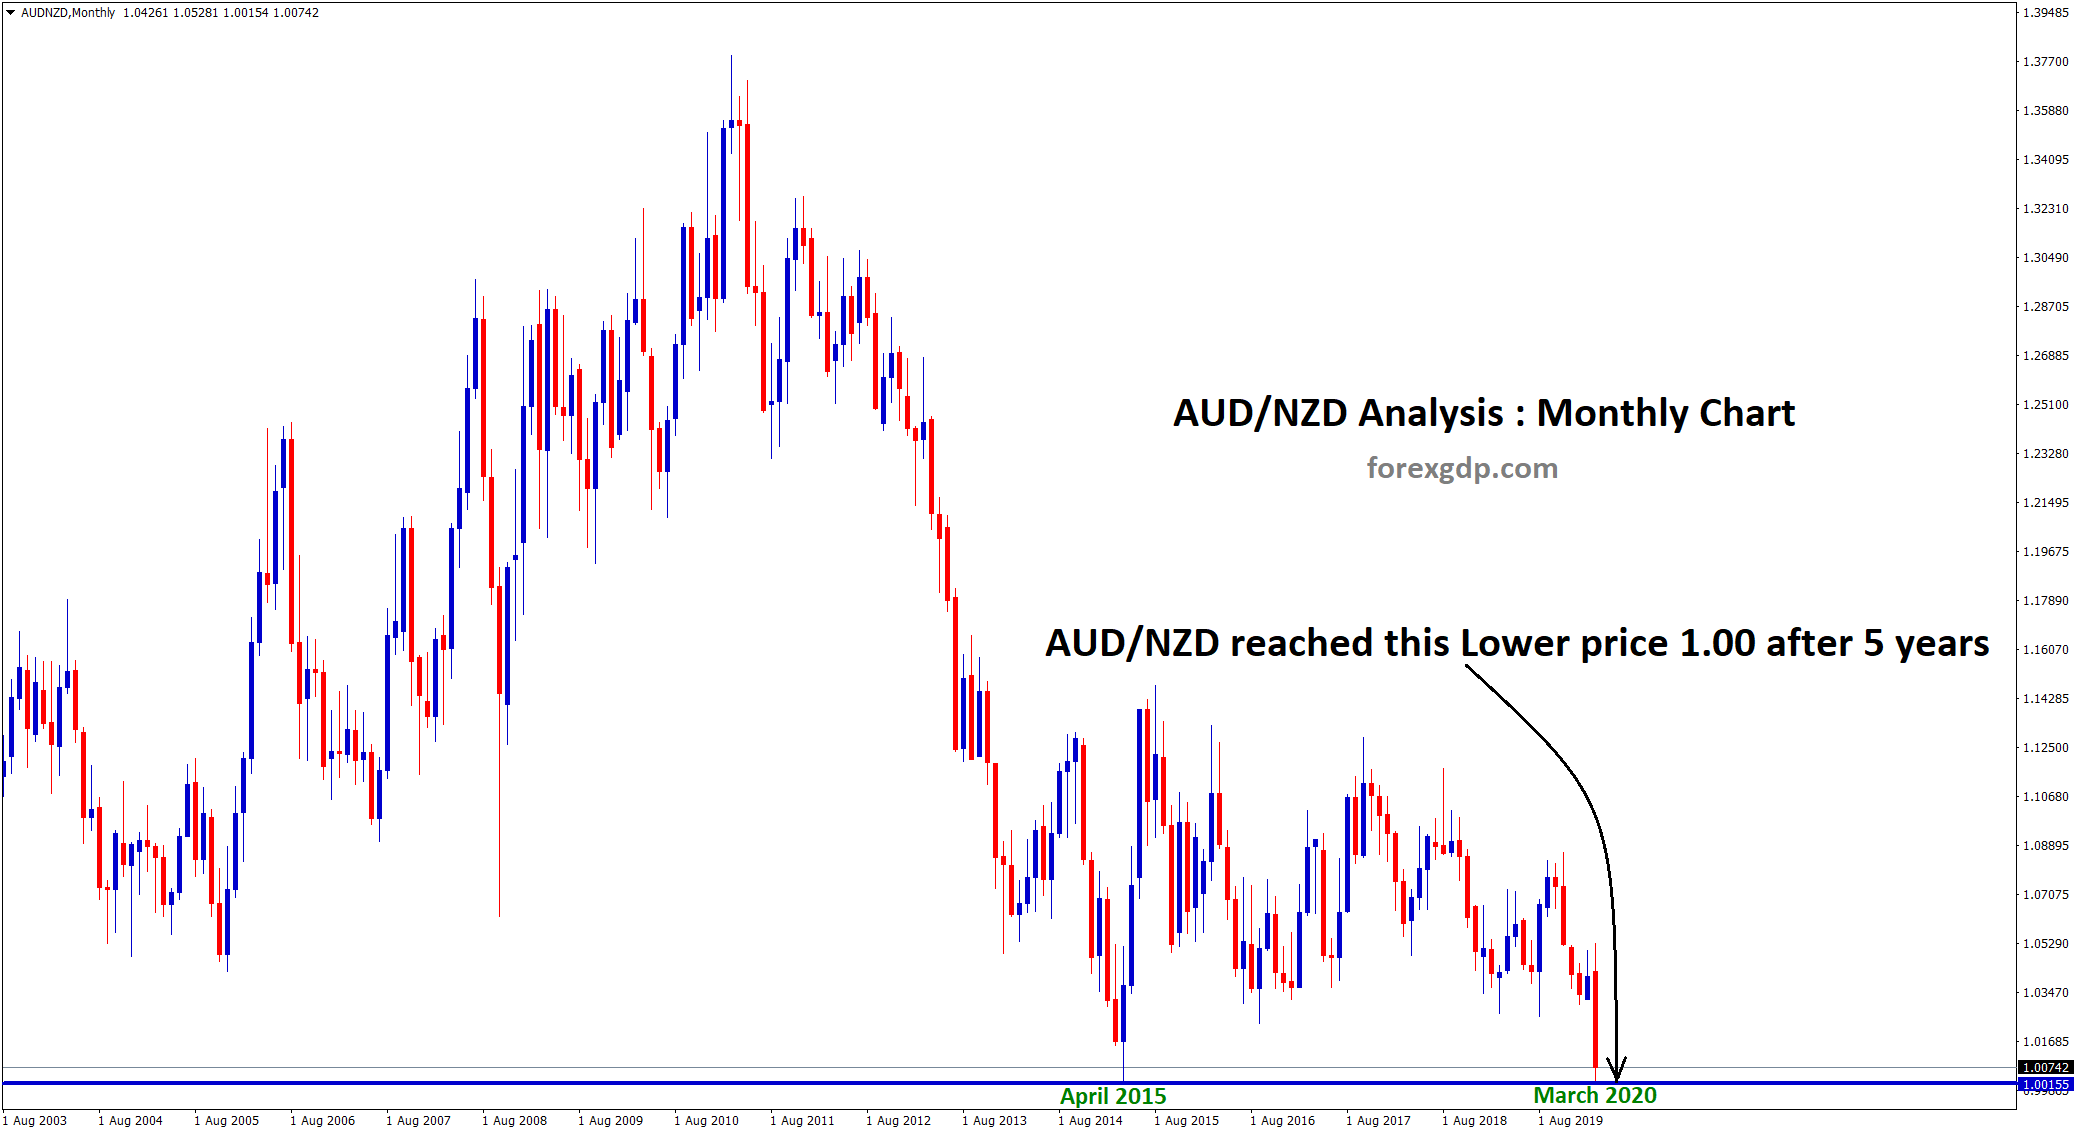
AUD NZD Technical trade Analysis in 5 years AUD/NZD reached the lower price 1.00 after 5 years. On April 2015,…
-
Coronavirus crashing the markets, Is it good to invest now?

Corona virus crashing forex, stocks, commodities, share market Corona virus starts to spread all over the world that really affecting…