usdchf short term
-
USDCHF at the higher high zone (top) of the uptrend line
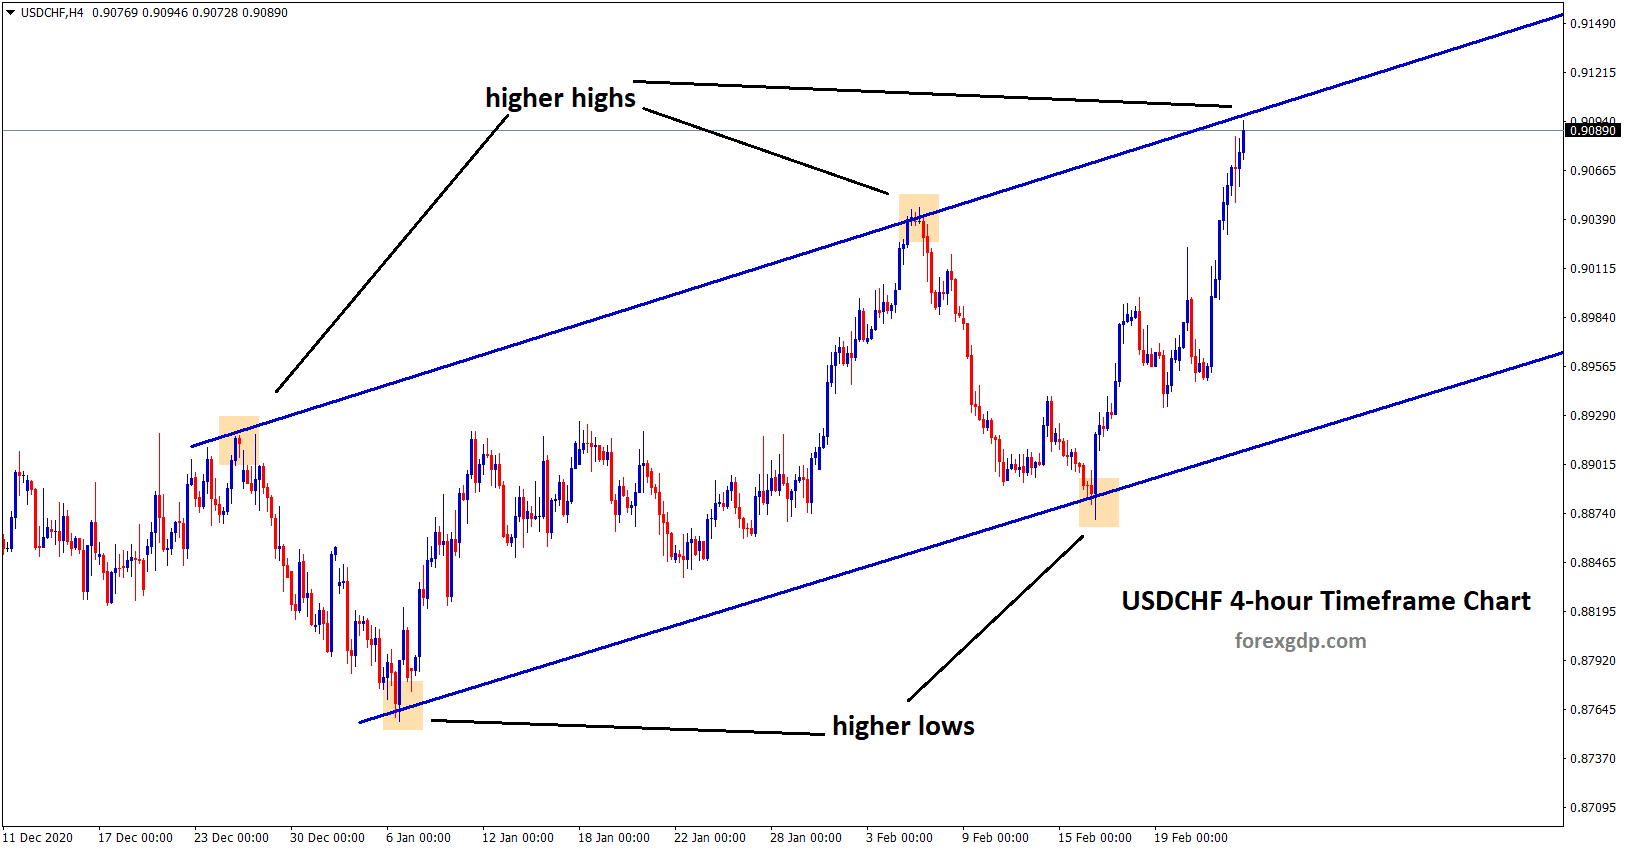
USDCHF has reached a higher high zone of the uptrend line. Let's wait for the confirmation of reversal or breakout.…
-
Ascending Triangle Pattern going to break soon on USDCHF

USDCHF Ascending Triangle Breakout Ascending Triangle pattern has formed in the USDCHF by creating Equal highs and higher lows. USDCHF…
-
USDCHF bouncing up from the broken level
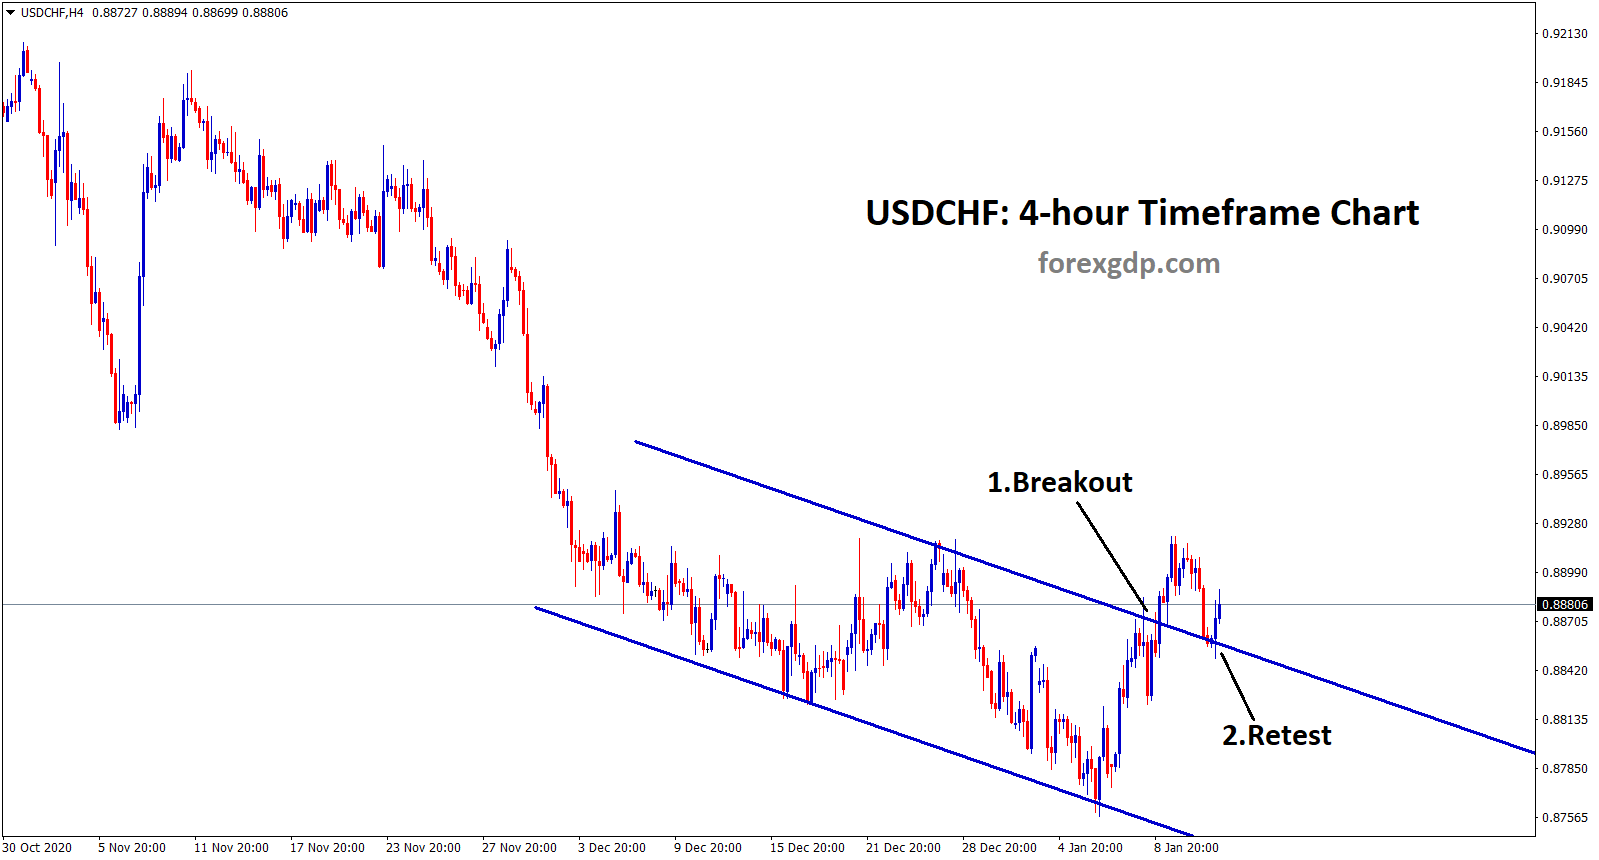
USDCHF Analysis USDCHF has broken the top level of the downtrend range. After the breakout, the USDCHF has retested the…
-
Channel Trading Opportunities on different currency pairs
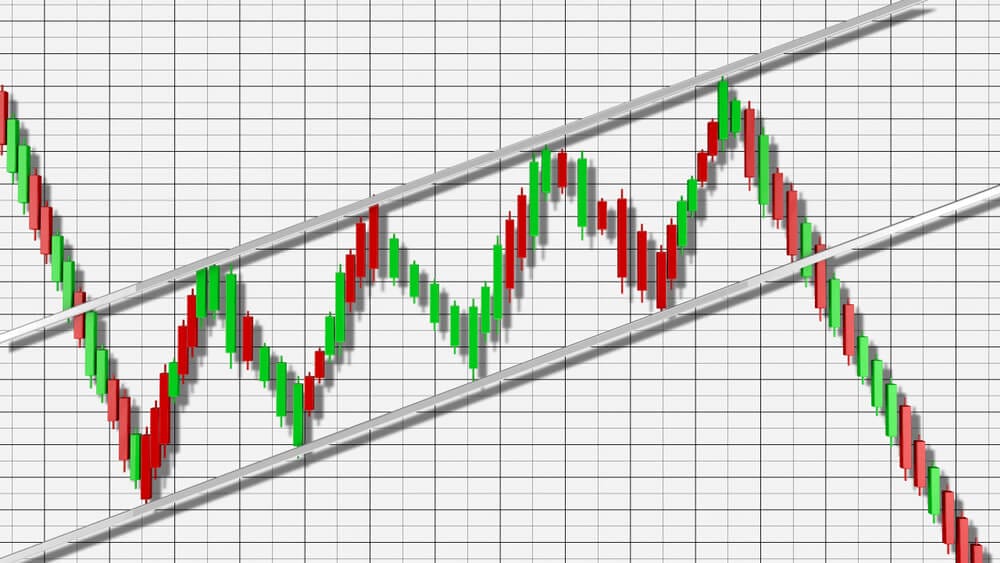
AUDUSD Analysis AUDUSD is moving in a strong uptrend by creating an Ascending Channel (higher highs, higher lows) in 4-hour…
-
USDCHF starts to bounce back from a higher low of Uptrend Line
USDCHF Technical Analysis USDCHF is moving in an Uptrend by forming higher high, higher low in 1-hour time frame chart.…
-
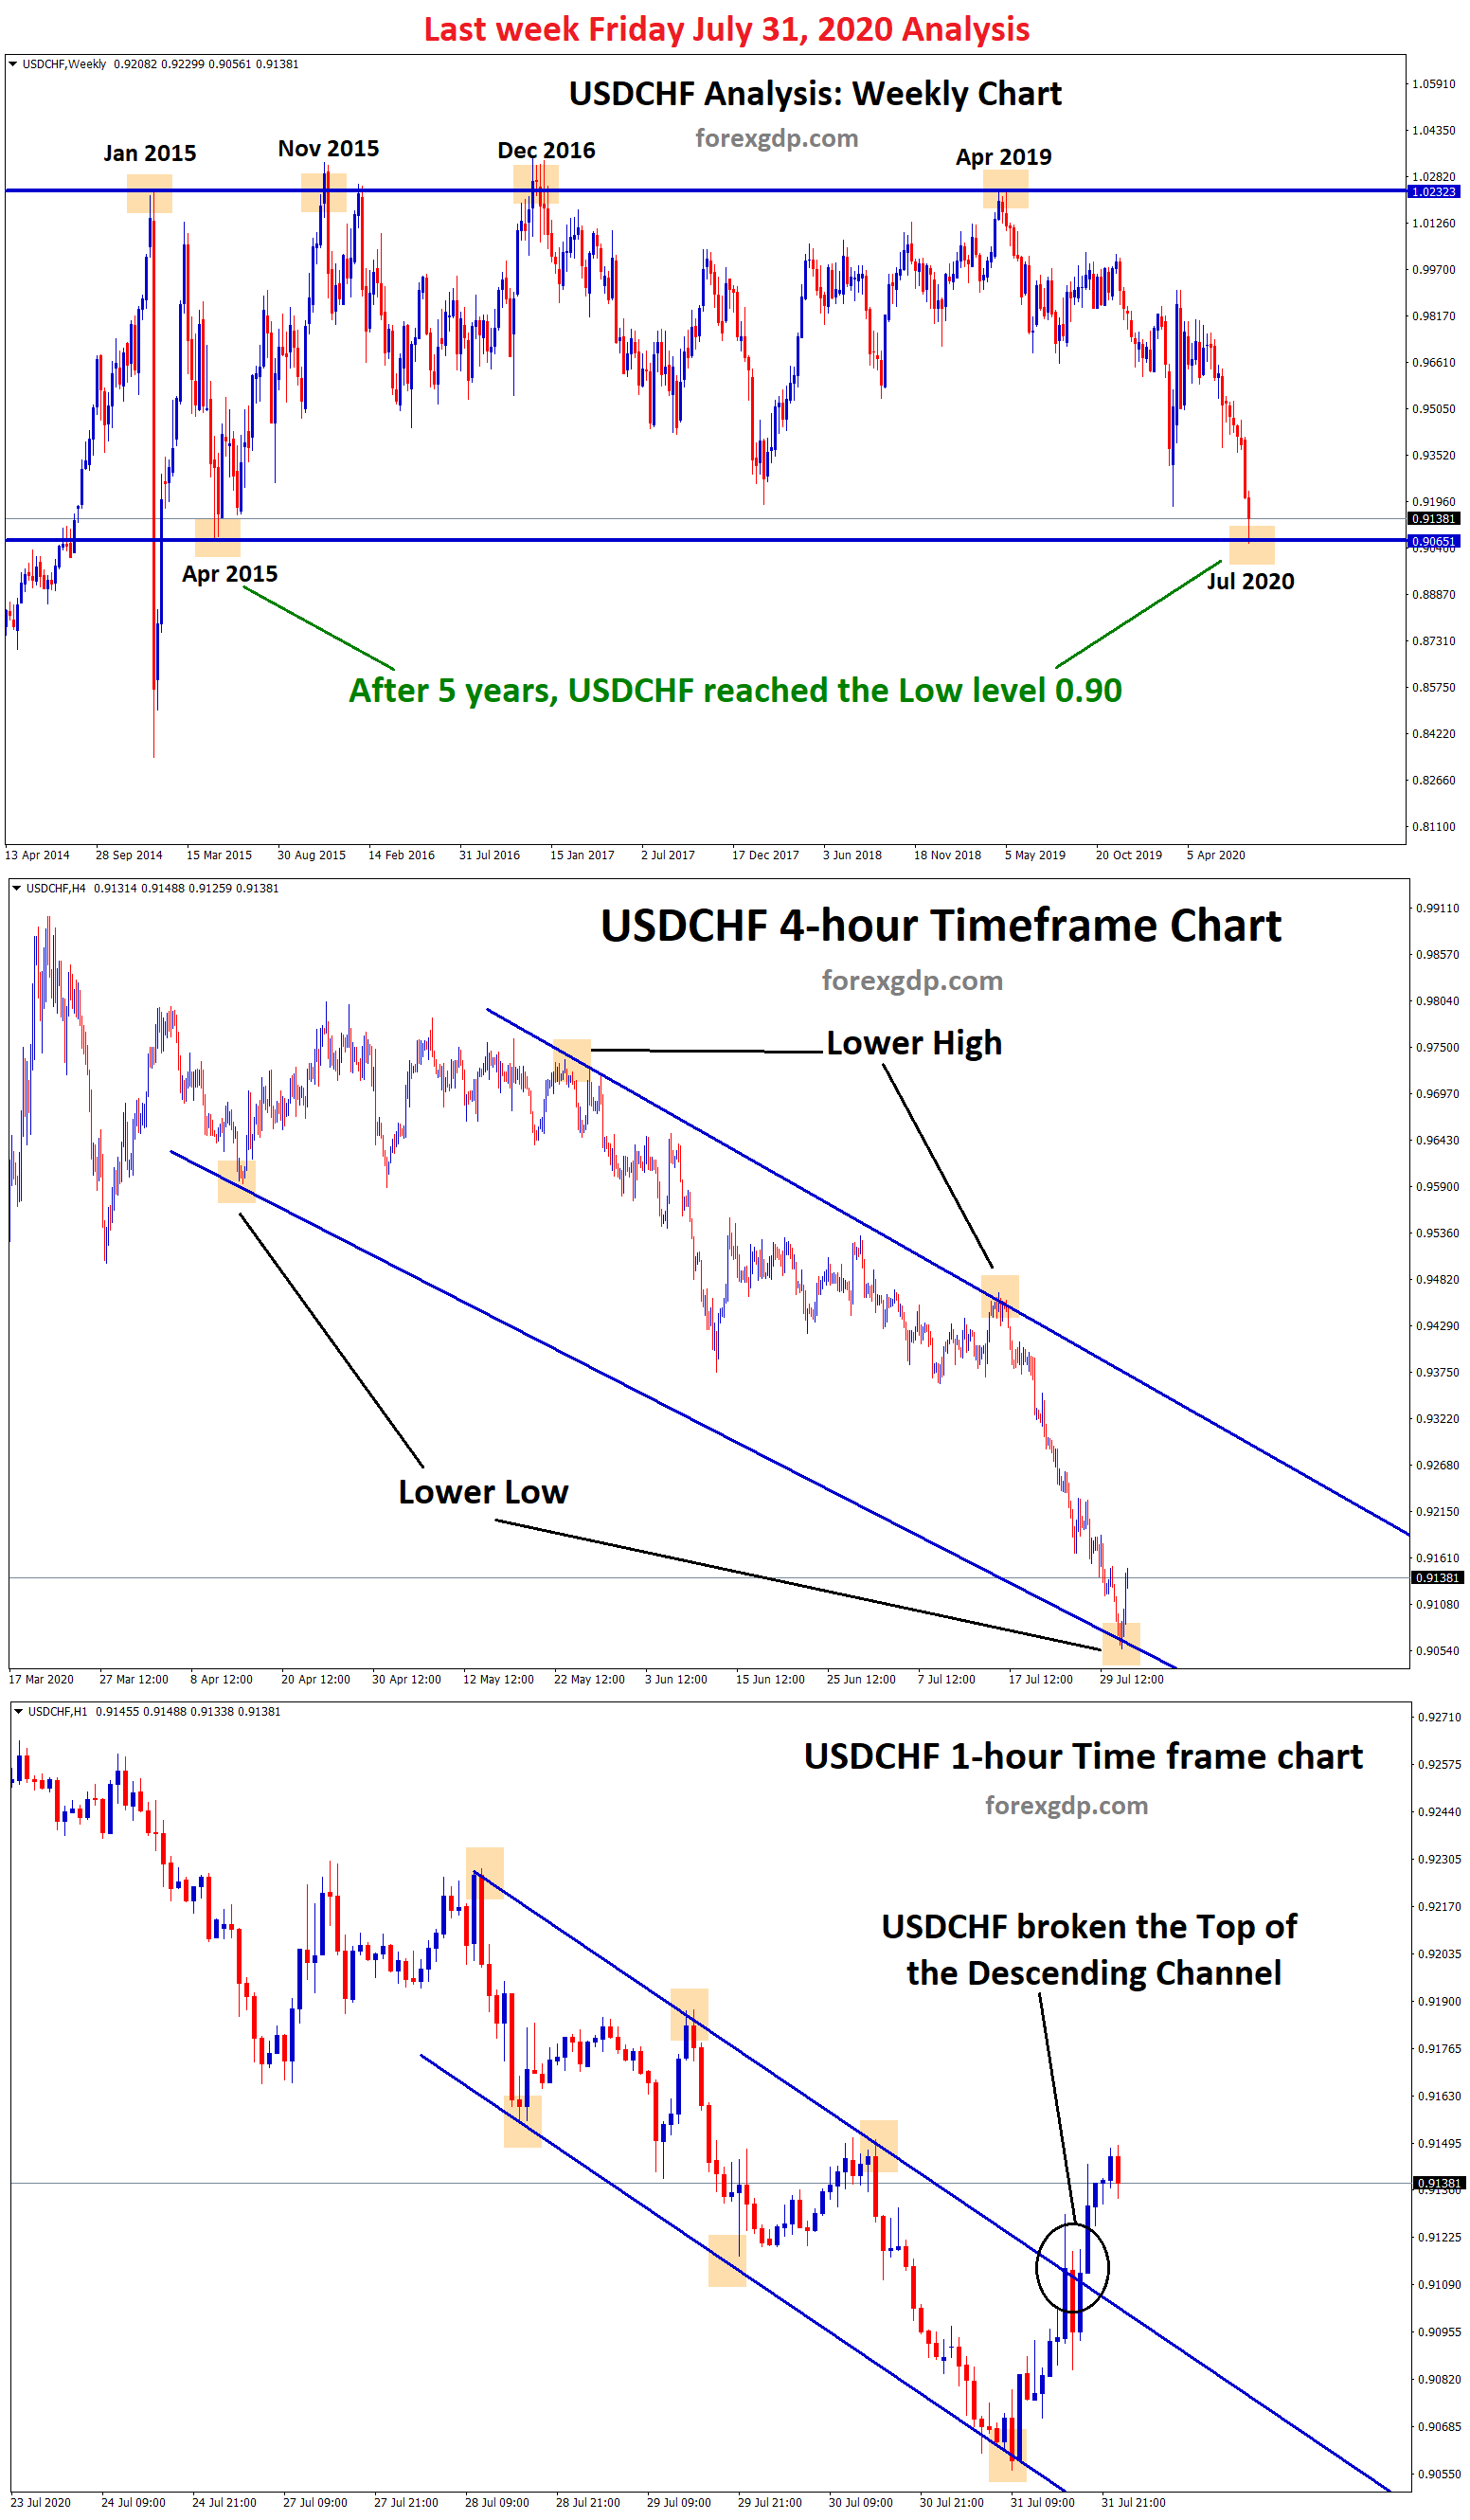
After 5 years, USDCHF reached the Low Price 0.90

USDCHF Full View Analysis Since from 2015, USDCHF is moving up and down between specific price ranges for a long…
-
EURGBP standing at the bottom level of horizontal SR and Trend line
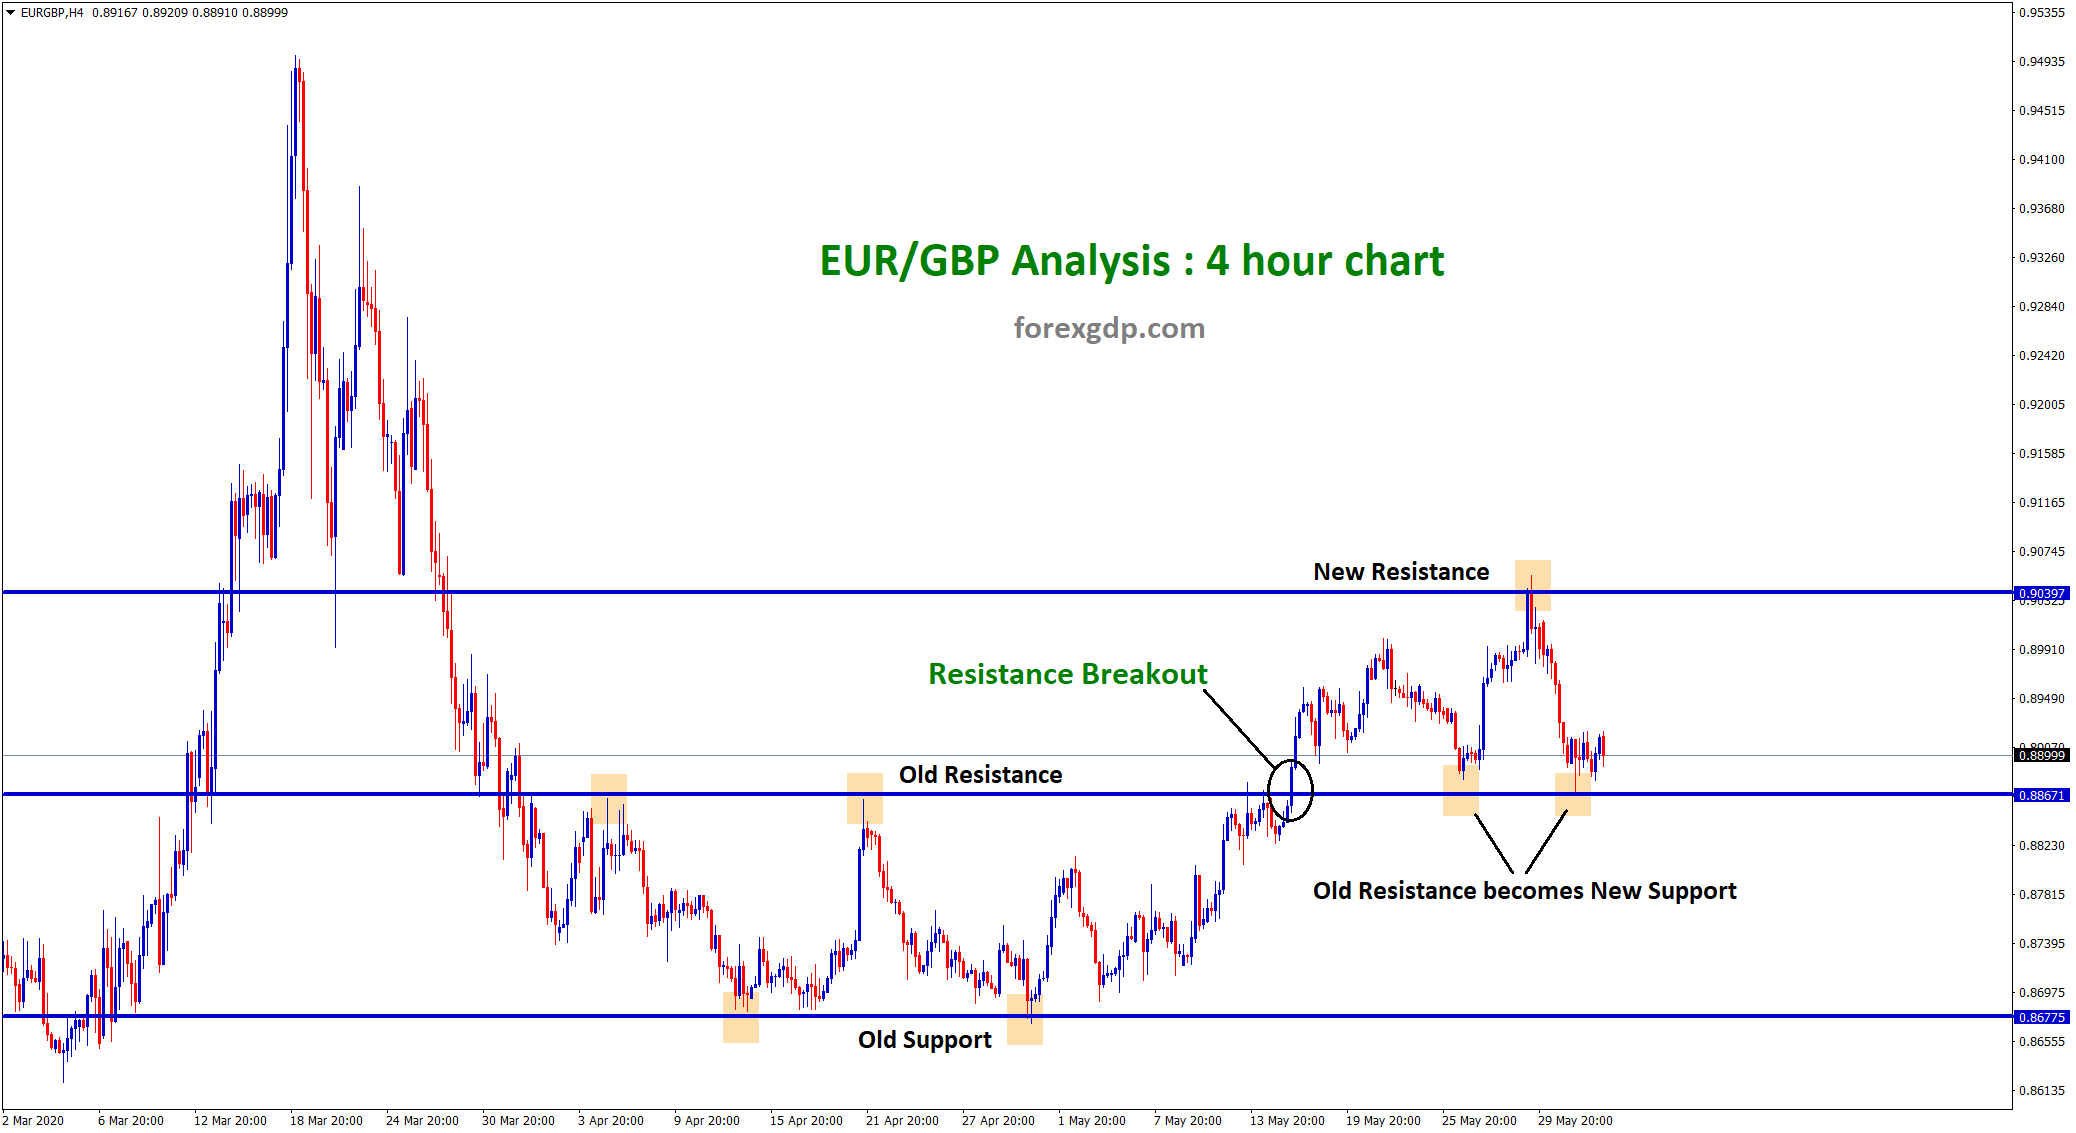
EURGBP Support Resistance Analysis (SR Strategy) ✔️EURGBP broken the resistance level recently. After breakout, New resistance is formed. ✔️The…
-
Symmetrical Triangle broken on USDCHF after long time
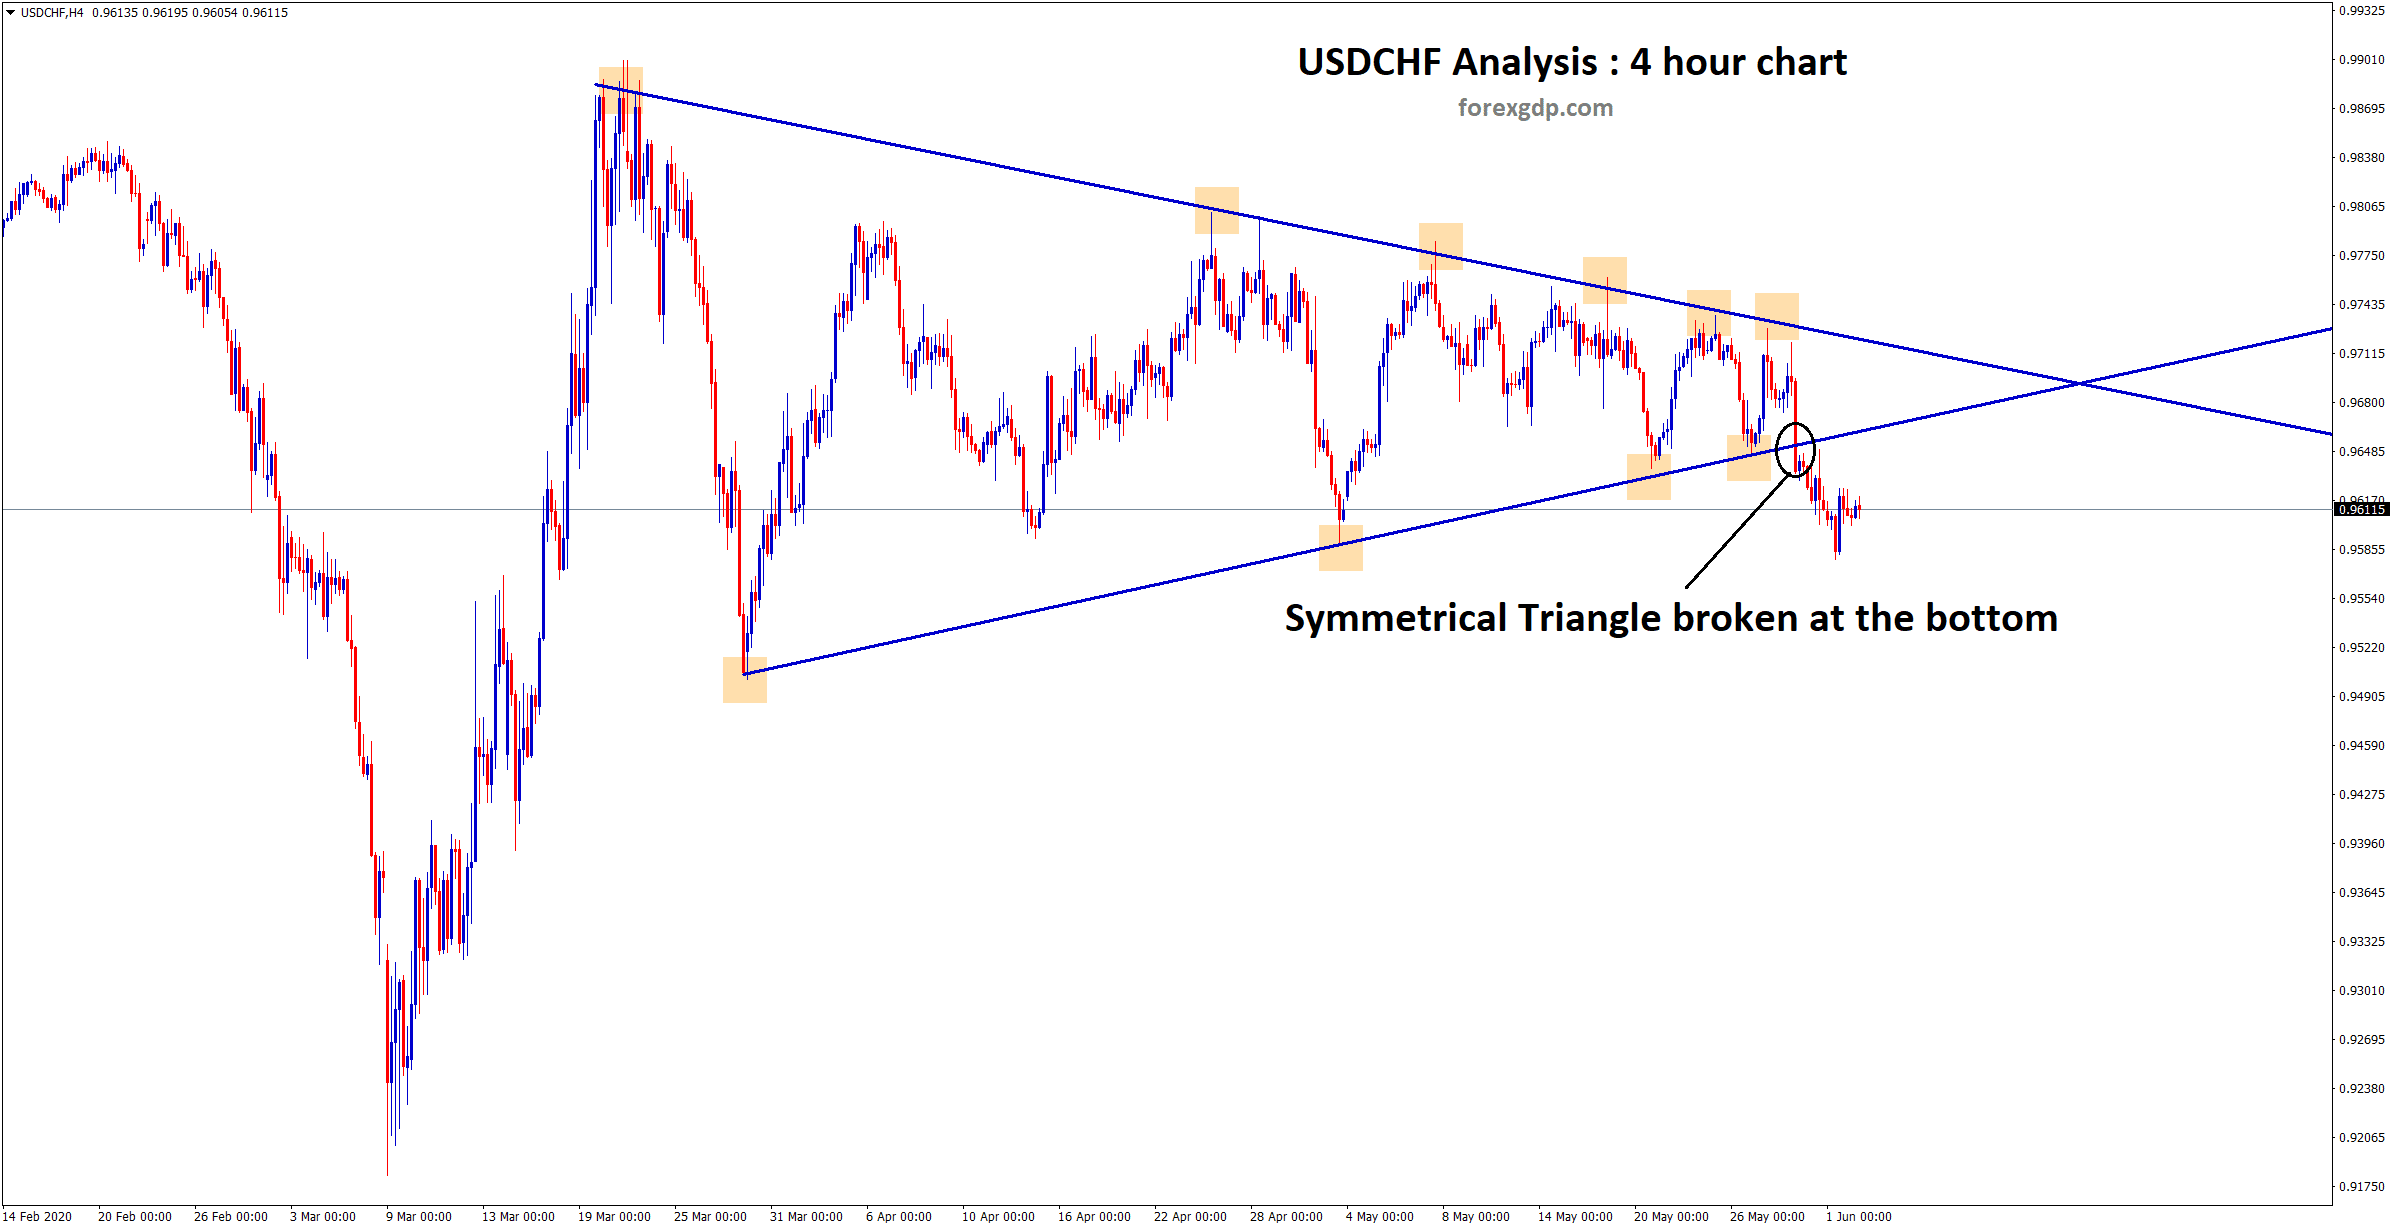
USDCHF starts to fall after a breakout We are waiting for a long time for this symmetrical Triangle breakout (check…
-
USDCHF Triangle going to break soon
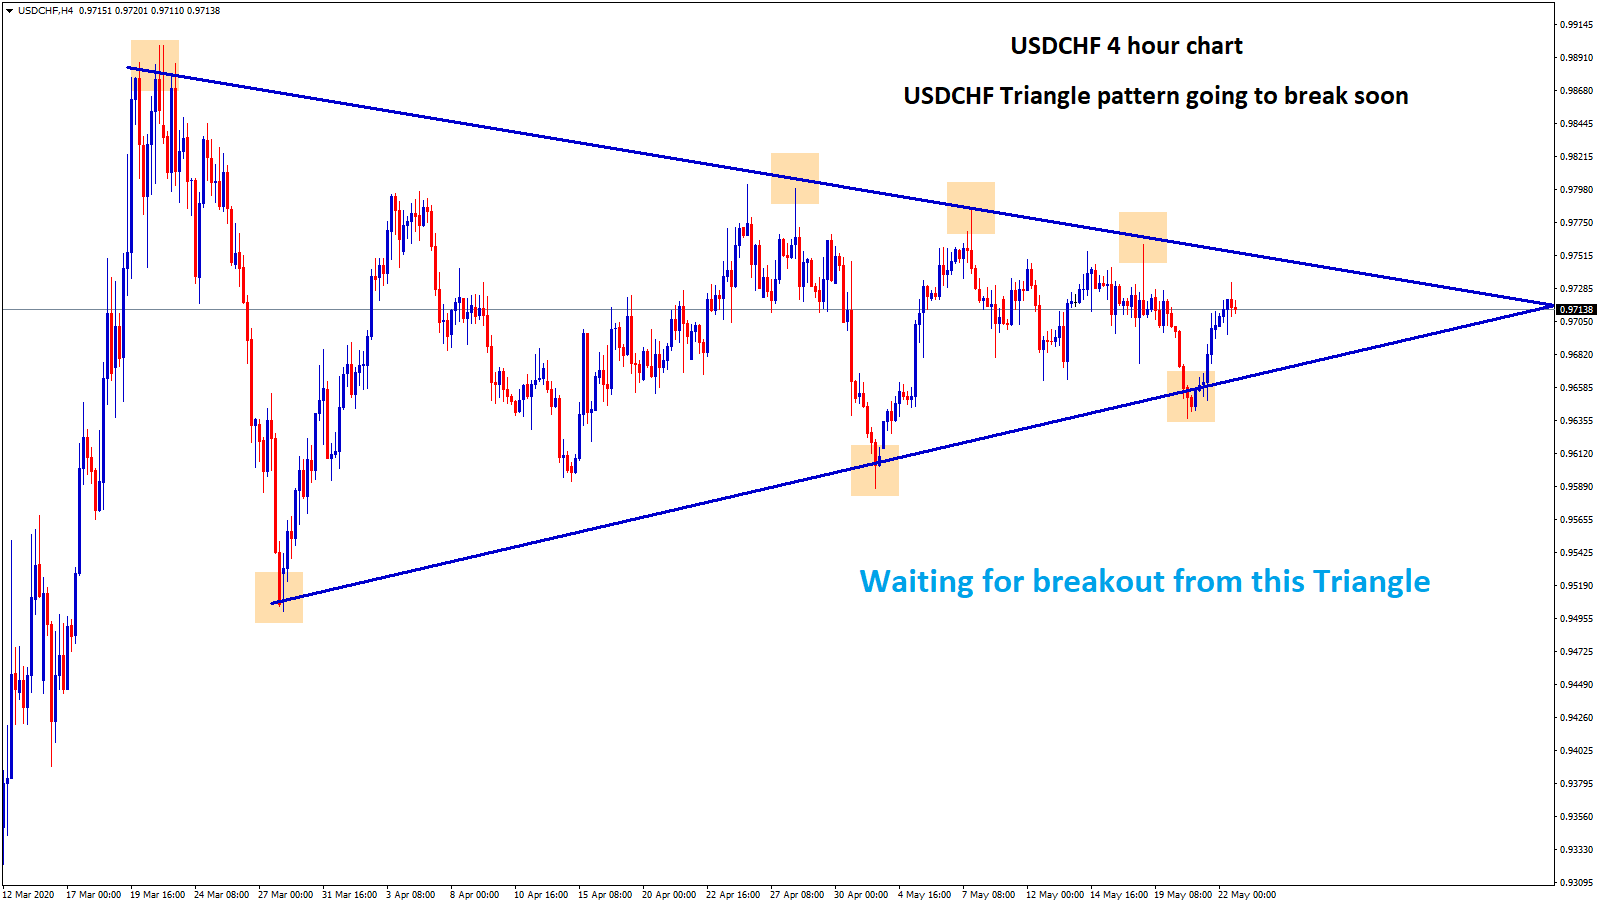
USDCHF Triangle chart pattern in four hour time frame USDCHF is moving up and down between the Triangle price range…
-
Symmetrical Triangle Pattern on EURUSD USDCHF
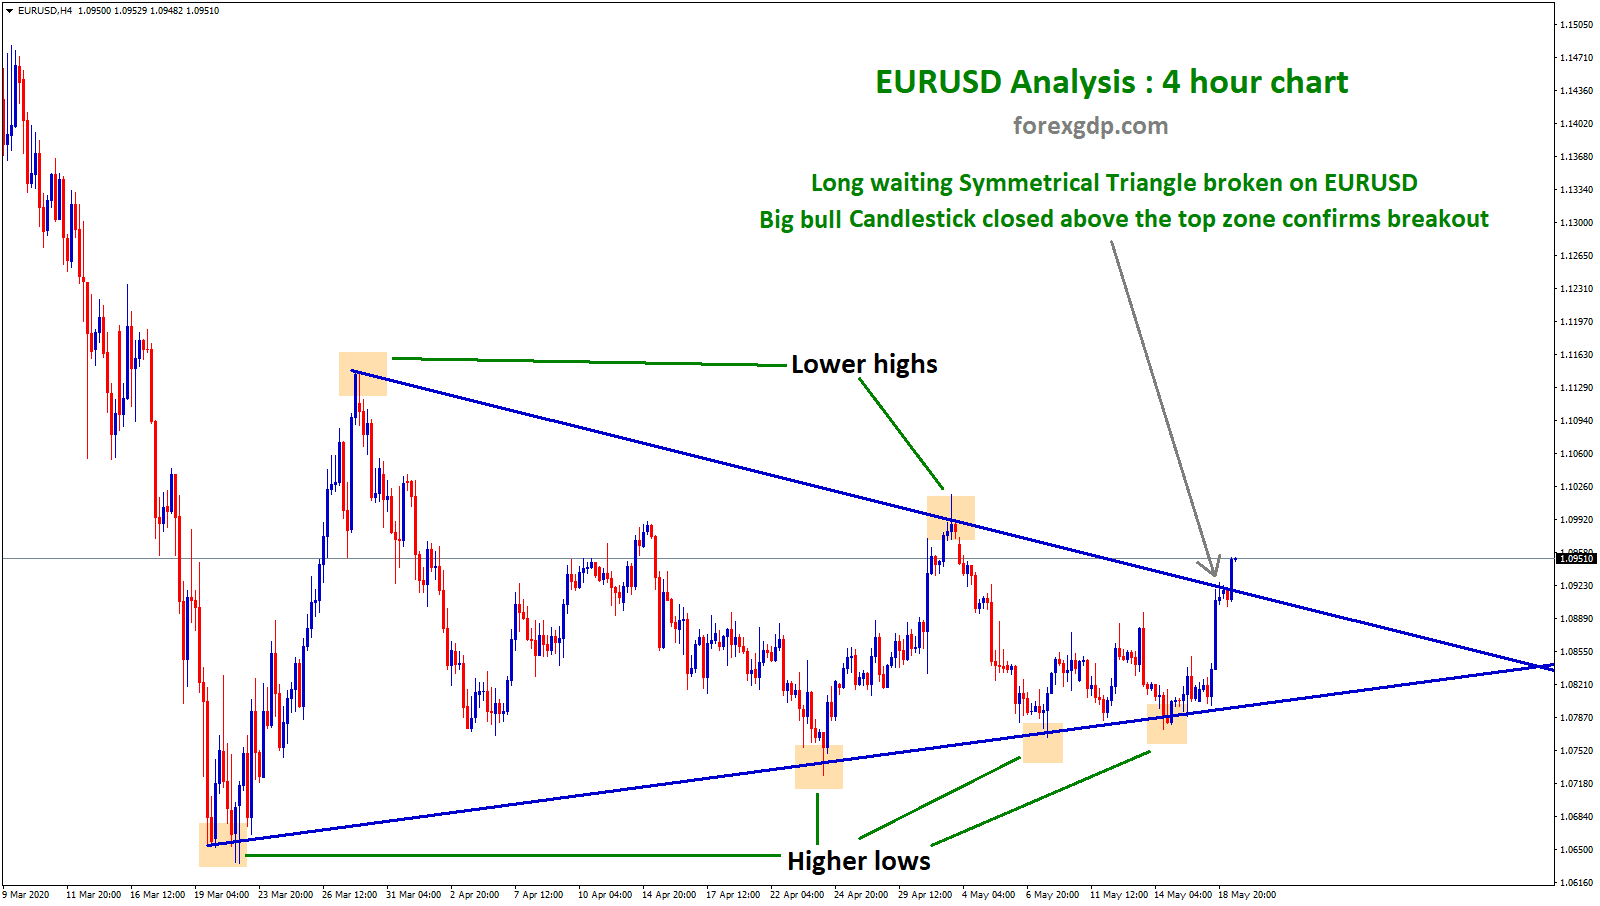
Symmetrical Triangle broken on EURUSD, waiting on USDCHF Lower Highs, Higher Lows creates a Symmetrical Triangle Pattern. Symmetrical Triangle pattern…
-
USDCHF standing at the bottom of trendline

USDCHF Trendline analysis at the bottom zone USDCHF is moving in an up trendline by forming higher highs, higher lows…
-
USDCHF starts to fall as USD becomes too weak due to Corona cases
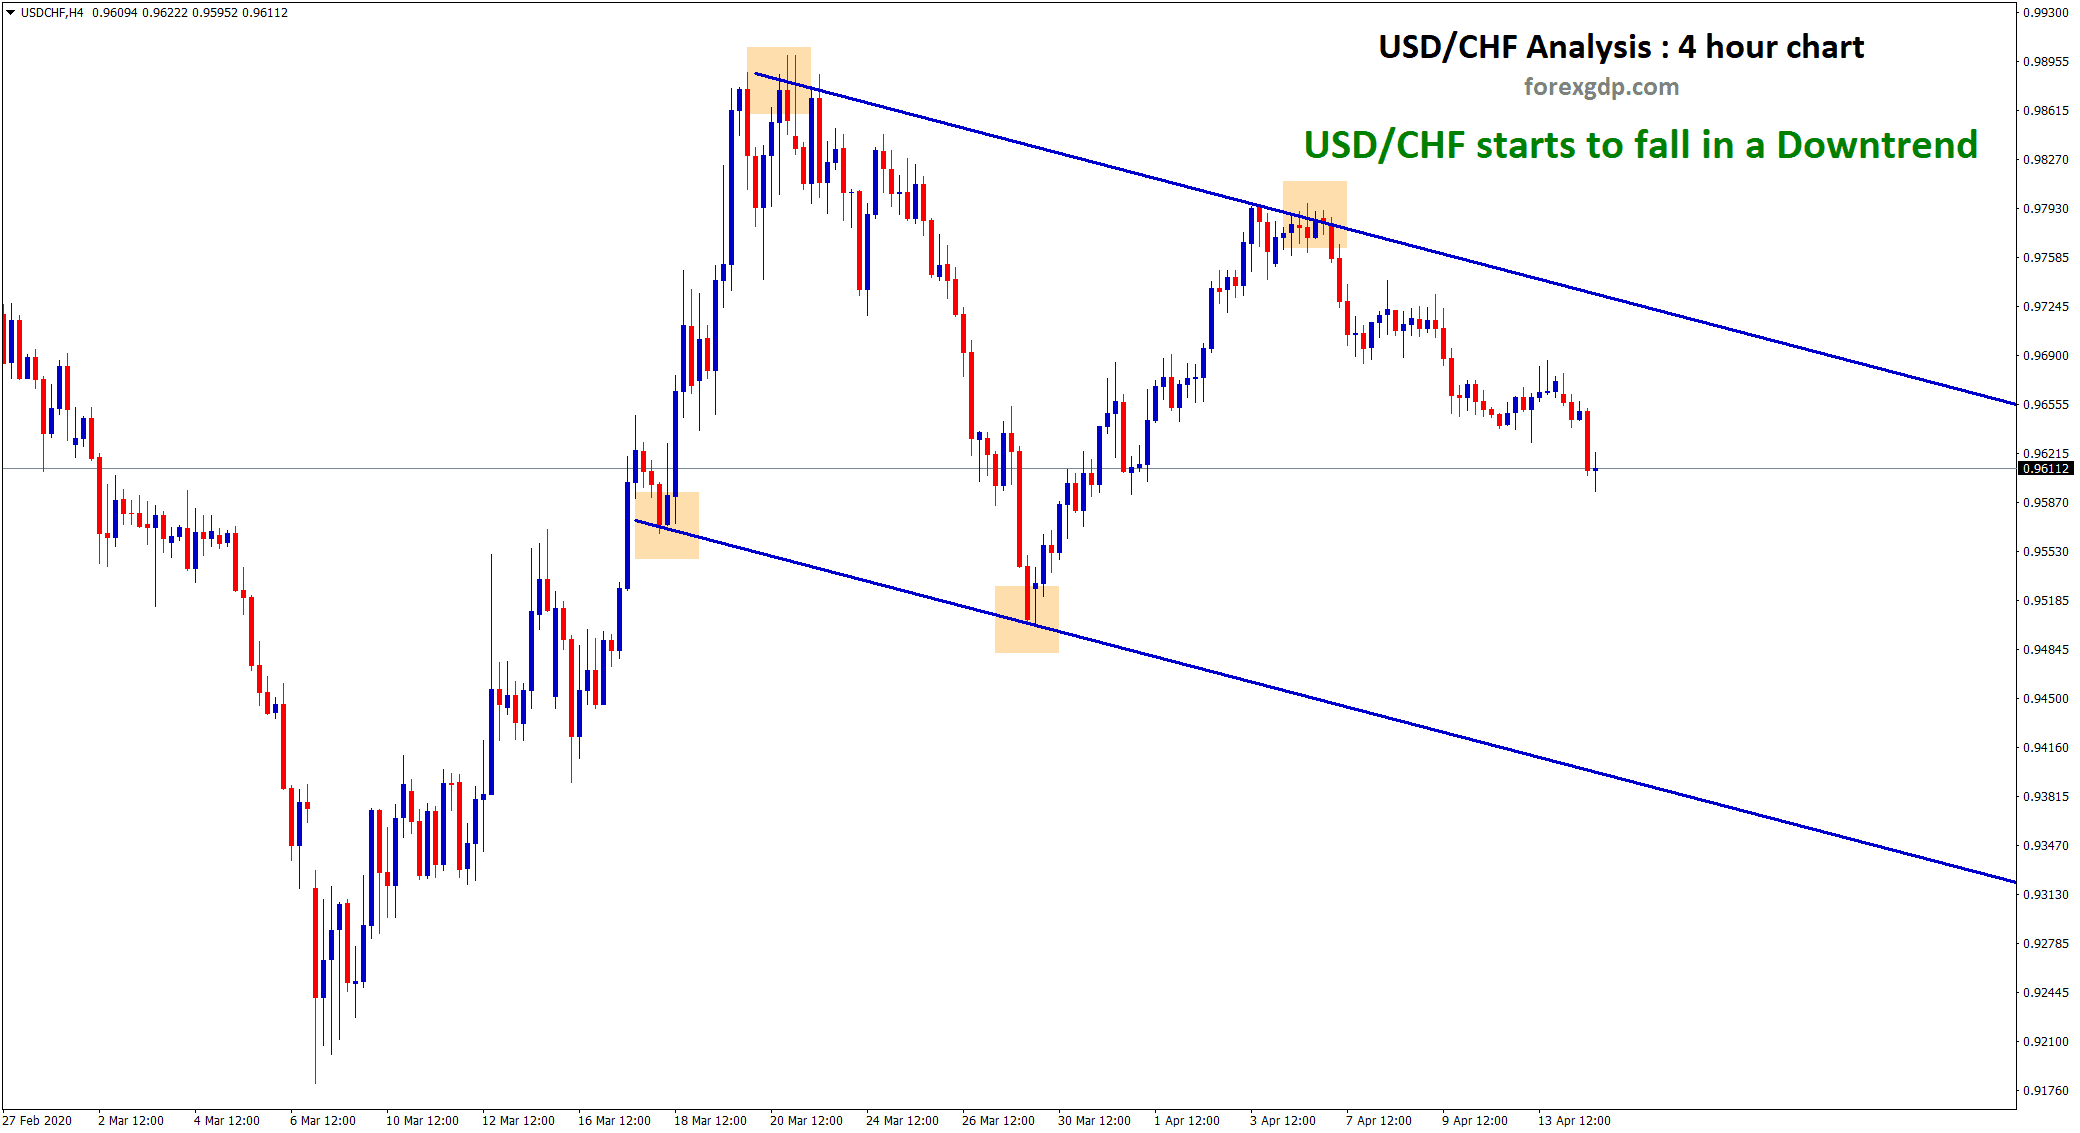
USDCHF Analysis for sell trade signal United states hold No.1 Rank in Coronavirus cases and deaths (click here to see).…